
The Big Five: Five Dimensions Recovered from Language, and the Boundary Nobody Has Settled
Five dimensions, recovered not from a theory of the mind but from the vocabulary a language keeps for describing people. The structure holds up unusually well under retesting: it comes back out of self-reports, peer ratings and lexical analysis, and a preregistered, high-powered replication project found 87 percent of 78 published trait-outcome associations holding up, at about 77 percent of their original size, which is a record most areas of psychology would envy. Which makes the failure mode here overstatement rather than invention. Our own research file credits a 1997 paper with replication in more than fifty cultures, and that paper studied six translations of one inventory. A forager-farmer population in the Bolivian Amazon did not yield the five factors; 29 face-to-face surveys covering 94,751 respondents across 23 low- and middle-income countries did not pass standard validity tests on the usual questionnaires; and whether that is a limit on the structure or a limit on the instrument is unsettled. This page carries the taxonomy at full strength, leaves the boundary open, reads heritability the way a behaviour geneticist reads it, and uses the Myers-Briggs not as a target but as the clearest available way to see what a continuous dimension is.
Somebody hands you a questionnaire. You work through a long list of statements about yourself, and out come five numbers. The five are not five kinds of person. They are five directions, and everybody sits somewhere along each of them, usually not far from the middle. The interesting question is not what your five numbers say about you. It is where the five came from, because they did not come from a theory of the mind. They came from a dictionary.
The Big Five has a replication record most areas of psychology would envy, and that is exactly what makes it hazardous to write about. The risk here is not invention but inflation: a well-supported taxonomy is easy to describe in language that quietly promotes it into a law of human nature. Three things are kept bright on this page. The structure replicates well in large, literate, industrialised, questionnaire-taking populations, and its boundary beyond them is contested rather than settled. Its power to predict real outcomes is genuine and modest, and the field's own numbers have been revised downward rather than up. And it is not the Myers-Briggs Type Indicator, which is a difference of kind and not of quality.
Two boundaries and one rule before we start. Carl Jung, whose reading of psychological types is the ancestry the Myers-Briggs instrument claims, belongs to this wing's article on the archetypes and appears here in a single clause. The systematic errors of judgment, anchoring and the rest of the catalogue, belong to the mind's blind spots. Clinical psychopathy is not this article's subject either: the Dark Triad material in section 09 is trait taxonomy, not diagnosis. And the rule: where our own research file, T_1_08, states a figure its own cited source does not report, or one the wider literature has since roughly halved, or draws a conclusion more confidently than the evidence carries, this page says so at the point the claim would have been made rather than quietly printing the better version. That happens repeatedly below, and every instance is gathered again in the source notes at the foot of the page.
01A Map Drawn from a Dictionary
The idea underneath the Big Five is older than psychology's use of it, and it begins with a count. Francis Galton, in an essay called Measurement of Character published in the Fortnightly Review in 1884, reasoned that the number of conspicuous aspects of human character could be gauged by counting the words a language keeps for describing them. He went through an appropriate dictionary, Roget's Thesaurus, sampled many pages of its index, and estimated that it contained fully one thousand words expressive of character, each with a separate shade of meaning. That casual count is the origin of the lexical tradition, and the lexical tradition is what eventually produces five factors. Galton also founded eugenics and coined the word, which is not a detail that can be dropped from a sentence putting him at the head of a story about measuring people. Neither the essay nor Galton appears in our own research file; both are added here.
The first systematic version of Galton's count is Allport and Odbert's, in 1936. They worked through an unabridged English dictionary, sorted the person-describing words into columns, and the column they judged to hold stable traits held about 4,500 terms. That number is not a discovery about people. It is a discovery about English, and about two men's judgment of which words name something durable. Everything downstream in this article inherits both of those facts.
State the premise plainly, because the rest of the article rests on it. The lexical hypothesis holds that personality-relevant differences between people get encoded in the everyday vocabulary of a language: if a difference matters enough, some language will eventually coin a word for it, and so counting and sorting the words is a way of surveying the space. That premise is doing enormous work and it is not obviously true. Section 12 gives it the argument it deserves. Everything between here and there is what the premise produced.
02Sixteen Factors That Would Not Replicate, and Five That Did
Cattell took the lexical list and compressed it. Working across roughly 1943 to 1957 he applied cluster analysis and arrived at 16 primary factors, measured by the questionnaire that still carries the name, the 16PF. Our own file states the outcome in the same sentence as the achievement, and the outcome is the whole reason the Big Five exists: the sixteen-factor structure proved difficult to replicate across laboratories. Goldberg's 1990 paper reviews that failure and the convergence on five from inside the tradition; Block's 1995 critique covers the same history from the other side. Five factors are not five because five is the natural number of things a person is. Five is what survived when different laboratories, different samples and different item sets were asked to produce the same answer.
The five were first recovered in a place academic psychology was not reading. Tupes and Christal reported five recurrent factors in a United States Air Force technical report in 1961, Recurrent Personality Factors Based on Trait Ratings. It sat in the Air Force technical literature, and the Journal of Personality reprinted it in full only in 1992, by which point the structure it described had been rediscovered several times over. Our own file's account of the discovery starts with Norman in 1963 and does not mention them, which hands Norman a priority that is not his: Norman was replicating Tupes and Christal. The five dimensions were first set out in a military technical report, filed, and left largely unread for three decades.
Norman, in 1963, ran factor analyses of trait-adjective ratings and reported a replicated five-factor structure in peer-nomination ratings. Goldberg, in 1990, arrived at the same five from a different direction and gave the set the name that stuck. Both papers are in our file and both are correctly cited there. The correction above is about what precedes them, not about them.
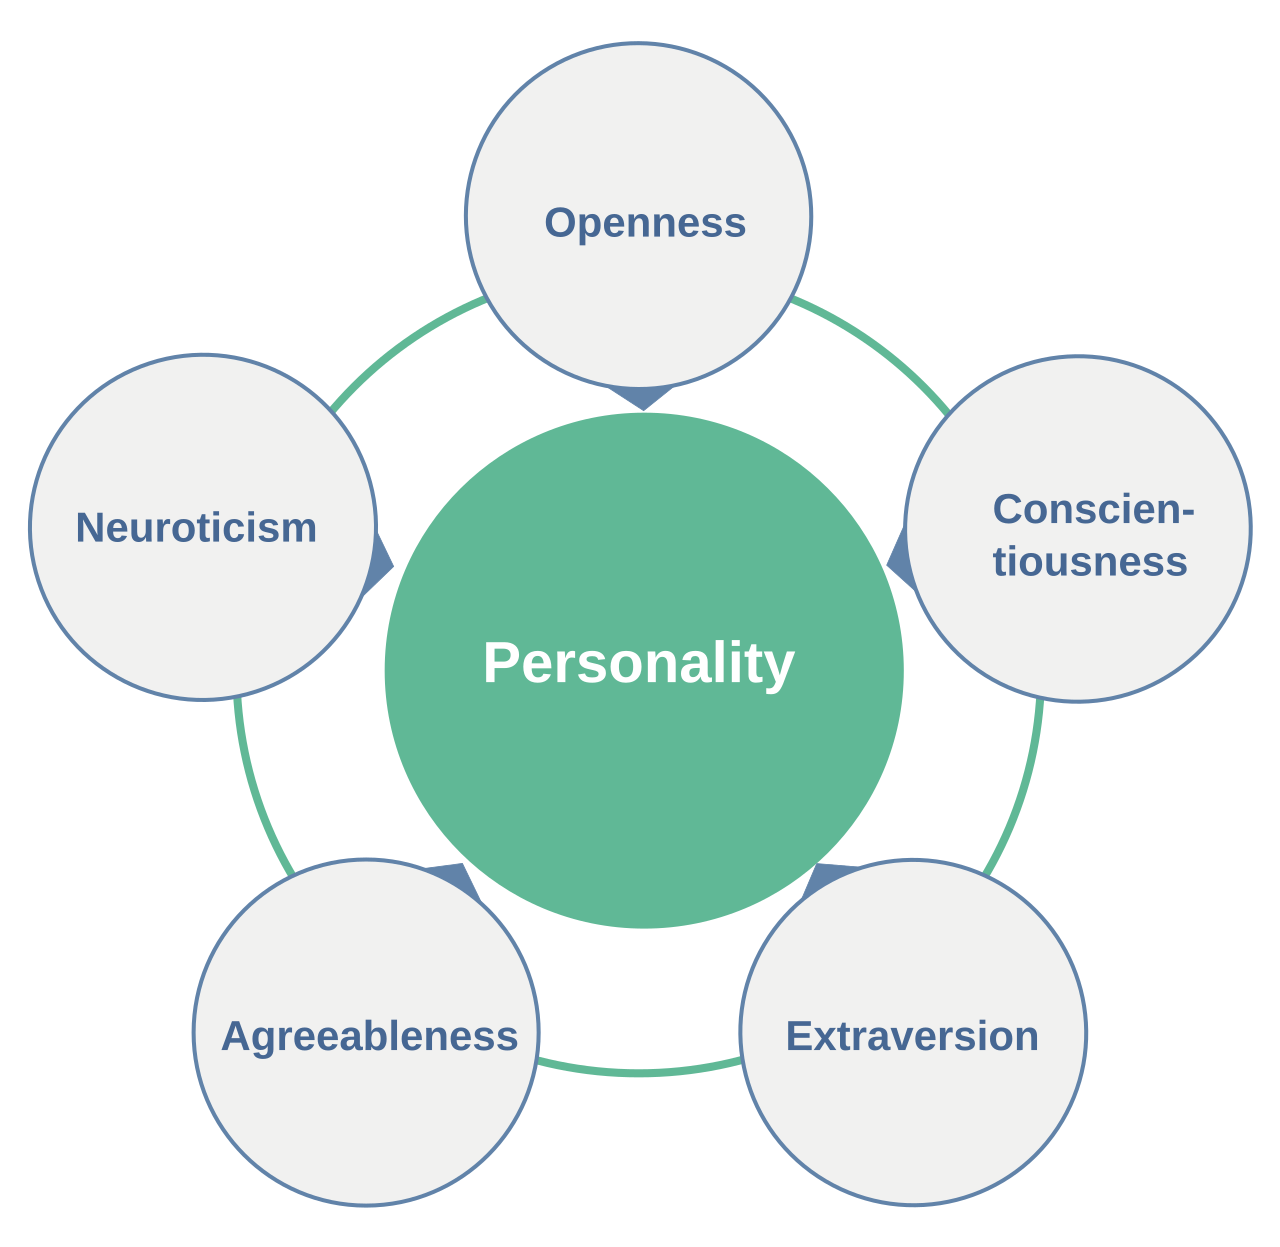
So, the model stated flatly. Five broad dimensions: Openness to Experience, Conscientiousness, Extraversion, Agreeableness and Neuroticism, which spell OCEAN and are also called the Five-Factor Model. Factor-analytic studies recover these five from diverse personality questionnaires, from behavioural ratings, and from linguistic analysis of social media text, and it is the dominant taxonomic framework in the field. Now read what that sentence claims and what it does not. It claims that when a lot of people are measured on a lot of trait words, and the smallest set of dimensions that reproduces the pattern is extracted, five keeps coming back. It does not claim that there are five things inside a person.
The instrument our file calls the gold standard is the Revised NEO Personality Inventory, developed by Costa and McCrae and published in 1992: 240 items resolving to 30 facets, six of them under each of the five domains. The facet layer is where the model stops being abstract, and it is the answer to the objection most readers reach for first, that five dimensions are far too coarse to describe anybody. They are. The facets are what the coarse dimensions are made of, and two people with identical Extraversion scores can be assembled from quite different facets underneath. The inventory is a copyrighted commercial instrument, so no item, scoring key or profile sheet from it appears anywhere on this page.
| Domain | The Six Facets Beneath It |
|---|---|
| Openness to Experience | Fantasy, aesthetics, feelings, actions, ideas, values |
| Conscientiousness | Competence, order, dutifulness, achievement striving, self-discipline, deliberation |
| Extraversion | Warmth, gregariousness, assertiveness, activity, excitement-seeking, positive emotions |
| Agreeableness | Trust, straightforwardness, altruism, compliance, modesty, tender-mindedness |
| Neuroticism | Anxiety, hostility, depression, self-consciousness, impulsiveness, vulnerability |
03How Far the Structure Travels
This is where an article about the Big Five is likeliest to overstate, and where our own file does. T_1_08 reports that the five-factor structure replicated in more than fifty cultures across six continents using translated versions of the inventory, with factor congruence coefficients above 0.90 for all five factors in most of them, and attaches the whole sentence to McCrae and Costa's 1997 paper in American Psychologist. That paper analysed six translations of the Revised NEO Personality Inventory: German, Portuguese, Hebrew, Chinese, Korean and Japanese, drawn from five distinct language families, with 7,134 participants in total, and it reported that the American five-factor structure was closely reproduced in each. Six translations is a real and interesting result. It is not a census of fifty cultures, and the paper's own move is an inference toward universality from six diverse cases rather than a count of anything. The paper is titled Personality Trait Structure as a Human Universal, and a title is an argument being made, not a finding being reported.
A fifty-culture study does exist and it is not the one our file cites. McCrae, Terracciano and the members of the Personality Profiles of Cultures Project published Universal Features of Personality Traits From the Observer's Perspective: Data From 50 Cultures in the Journal of Personality and Social Psychology in 2005, eight years after the paper our file credits. Swapping it in changes two things at once, and both matter. The scale goes up. And the method changes from what people say about themselves to what other people say about them, which is a different kind of evidence, not a bigger helping of the same kind.
Our file also contains the strongest thing standing against its own universality claim, tucked into a subordinate clause. Saucier and Goldberg reviewed lexical studies in German, Dutch, Hungarian, Italian, Czech, Filipino, Hebrew, Turkish, Korean and Chinese in the Journal of Personality in 2001, and found that they generally recover factors resembling the Big Five, though some languages yield six or seven factors rather than five. Eight years later Saucier went further, concluding from inclusive lexical studies that six recurrent dimensions fit better than five. If the number of factors a language yields depends on the language, then five is not a fact about people. It is a fact about a particular family of samples analysed a particular way. That is not a debunking, it is the correct reading of what a factor solution is, and section 08 makes it explicit.
Two published tests ran outside those samples and both came back negative, and neither is in our file. The first is about the model, the second about the instruments. Gurven, von Rueden, Massenkoff, Kaplan and Lero Vie administered a Big Five instrument to the Tsimane, a forager-farmer population of the Bolivian Amazon, and reported in the Journal of Personality and Social Psychology in 2013 that the five-factor model did not hold on tests of internal consistency, response stability or external validity. Replication did not improve in a second Tsimane sample in which adults rated their spouses. What the data supported instead was a Tsimane Big Two: prosociality and industriousness. Traits the Big Five assigns to conscientiousness, being efficient, persevering and thorough, bundled together with being energetic, relaxed and helpful, cutting straight across the boundaries the model expects.
That result is itself contested, and the contest is unusually clean. Van der Linden, Dunkel, Figueredo, Gurven, von Rueden and Woodley of Menie re-analysed the same Tsimane data in the Journal of Cross-Cultural Psychology in 2018 and reached a different structural conclusion. Two of the 2013 paper's authors, including its first author, are on the re-analysis. One dataset, overlapping teams, two answers, both in print. That is what a live scientific question looks like from the outside, and carrying both is more honest than crowning either.
The larger test points the same way and states its conclusion very carefully. Laajaj and colleagues pooled 29 face-to-face surveys covering 94,751 respondents across 23 low- and middle-income countries and reported in Science Advances in 2019 that the commonly used Big Five question sets generally failed to measure the traits they are intended to measure, and did not pass standard validity tests in those samples. Read the conclusion as its authors wrote it. It is about the instruments failing, not about personality having a different shape in poorer countries. Collapsing that distinction produces a falsehood in either direction, and both directions are tempting.
| The Study | What It Tested | What It Reported |
|---|---|---|
| McCrae and Costa (1997), American Psychologist | Six translations of the Revised NEO Personality Inventory (German, Portuguese, Hebrew, Chinese, Korean, Japanese) from five language families, 7,134 participants | The American five-factor structure closely reproduced in each. Our own file describes this paper as covering more than fifty cultures across six continents. It does not |
| McCrae, Terracciano and the Personality Profiles of Cultures Project (2005), Journal of Personality and Social Psychology | Observer ratings rather than self-reports, across 50 cultures | Universal features of personality traits from the observer's perspective. This is where a fifty-culture figure genuinely lives, by a different method than the 1997 paper's |
| Saucier and Goldberg (2001), Journal of Personality | Lexical studies in German, Dutch, Hungarian, Italian, Czech, Filipino, Hebrew, Turkish, Korean and Chinese | Factors generally resembling the Big Five, though some languages yield six or seven rather than five. This clause is in our own file |
| Saucier (2009), Journal of Personality | Inclusive lexical studies reviewed together | Six recurrent dimensions rather than five, from the same author eight years on |
| Gurven, von Rueden, Massenkoff, Kaplan and Lero Vie (2013), Journal of Personality and Social Psychology | The five-factor model among the Tsimane of the Bolivian Amazon, including a second sample in which adults rated their spouses | No robust support on internal consistency, response stability or external validity. A Tsimane Big Two instead: prosociality and industriousness |
| Van der Linden, Dunkel, Figueredo, Gurven, von Rueden and Woodley of Menie (2018), Journal of Cross-Cultural Psychology | A re-analysis of the same Tsimane data, with two of the 2013 authors on the paper | A different structural conclusion. One dataset, two answers, both on the record |
| Laajaj and colleagues (2019), Science Advances | 29 face-to-face surveys, 94,751 respondents, 23 low- and middle-income countries | The commonly used question sets generally failed to measure the intended traits and did not pass standard validity tests. The conclusion is about the instruments, not about the people |
One further cross-cultural finding belongs here before the summing up, and it is robust and runs against the obvious prediction. Costa, Terracciano and McCrae reported in 2001 that women score slightly higher than men on Agreeableness and Neuroticism across nearly all the cultures studied, and that the differences are larger in more gender-egalitarian societies rather than smaller. Schmitt, Realo, Voracek and Allik found the same paradox across 55 cultures in 2008, and Mac Giolla and Kajonius replicated it in 2018. Our own file then draws a conclusion from it: that this contradicts social role predictions and suggests biological contributions. The finding is solid. That reading is one of at least two. Heine, Lehman, Peng and Greenholtz described the reference-group effect in 2002: a person answering a Likert scale rates themselves against an implicit local comparison group, so a difference between national means partly measures who the respondents were comparing themselves to. If the implicit comparison group differs between a more and a less egalitarian society, a measured difference can widen without any underlying trait difference changing at all. This page carries the pattern as robust and the biological reading as one interpretation among at least two, which is less than our file claims and considerably more than nothing.
Take the structure question as a whole, then. The boundary is genuinely open, and the two candidate explanations are nothing like each other. Either the five-factor structure is a feature of human personality that these studies failed to measure, or it is a feature of a particular kind of respondent: literate, schooled in abstraction, accustomed to rating themselves on numbered scales, and reachable by questionnaire. Nothing on this page settles that, and an article that settled it would be inventing a result. What can be said is narrower and still worth having. Within large, literate, industrialised, questionnaire-taking populations the five come back reliably. Outside them the evidence is mixed and the instruments are under suspicion.
Refused: that the Big Five is a human universal, that the same five dimensions have been found in every culture on Earth. The structure replicates well and repeatedly in large, literate, industrialised, questionnaire-taking populations, which is a genuine and non-trivial achievement, and the refusal does not diminish it. What it has not been shown to do is hold cleanly everywhere. The Tsimane data did not support it. Twenty-three low- and middle-income countries, 29 surveys and 94,751 respondents did not pass standard validity tests on the usual instruments. Several lexical studies recover six or seven factors rather than five. And our own file's more-than-fifty-cultures figure is attached to a paper that studied six translations. Whether the failures reflect a limit on the structure or a limit on the questionnaire is a live and unsettled question, and this page leaves it unsettled.
04Heritability, and the Word Almost Everyone Misreads
Before any number: heritability is a population statistic, not a personal one. A heritability of 50 percent does not mean that half of any one person's conscientiousness is genetic. It means that, in the particular population sampled at the particular time it was sampled, about half of the observed variance between people is statistically associated with genetic variance between them. It implies nothing about whether a trait can change, and the estimate itself moves with the environment: our own file on psychometrics, T_1_10, records that heritability estimates run lower in deprived environments and higher in enriched ones. T_1_08 makes heritability a headline claim and carries no version of this caveat anywhere. It is supplied here because the single most common misreading of this entire subject is precisely the one it blocks.
Twin studies put the heritability of all five factors in a moderate band, roughly 40 to 60 percent. Our file then prints five specific per-trait percentages and attributes them to Vukasovic and Bratko's 2015 meta-analysis in Psychological Bulletin. That meta-analysis does not report them. What it reports, across 62 independent effect sizes and more than 100,000 participants, is an overall heritability estimate of about 40 percent and a significant moderator effect of study design: twin designs give estimates slightly below .50, while family and adoption designs give estimates slightly above .20. The design split is the paper's actual headline, it is missing from our file entirely, and it is far more interesting than the five numbers it replaces, because it says the answer more than doubles depending on which relatives you compare. The origin of those five percentages could not be identified for this page. A figure whose source cannot be named does not get set in type here.
| How It Was Estimated | What The Number Means | What Came Out |
|---|---|---|
| Twin designs, pooled (Vukasovic and Bratko, 2015) | Resemblance between identical and fraternal twins, pooled across studies | Slightly below .50 |
| Family and adoption designs, pooled (same meta-analysis) | Resemblance between relatives who are not twins, including adoptees | Slightly above .20. The design moves the answer by more than a factor of two |
| All designs pooled (same meta-analysis) | One overall figure across 62 independent effect sizes and more than 100,000 participants | About 40 percent |
| One twin study, per trait, SINGLE STUDY (Jang, Livesley and Vernon, 1996) | Broad heritability for each factor separately, from one sample rather than a pooling | Openness 61 percent, Extraversion 53 percent, Conscientiousness 44 percent, Neuroticism 41 percent, Agreeableness 41 percent. These are not the five percentages our own file prints |
| Common genetic variants measured directly (Power and Pluess, 2015) | Variance attributable to measured common variants, not inferred from family resemblance | Neuroticism 15 percent and Openness 21 percent reached statistical significance. Extraversion, Agreeableness and Conscientiousness did not |
| Shared environment, from the behaviour-genetic decomposition | Everything siblings raised in the same household have in common | Roughly 0 to 11 percent of adult variance |
The rest of the variance is not where most readers would put it. Shared environment, meaning everything siblings raised in the same household have in common, contributes relatively little to adult Big Five variance, roughly 0 to 11 percent. What remains beyond heritability is non-shared environment plus measurement error, and that last phrase is doing quiet work. A slice of what looks like environmental influence is simply the unreliability of the questionnaire: the same person answering the same instrument twice does not give the same answers, and that noise has to land somewhere in the accounting. Our own file's counter-argument table makes the identical point from the other side, setting about 50 percent non-shared environment plus error against the claim that personality is primarily genetic.
Molecular genetics is where the story gets strange. Personality traits are highly polygenic: thousands of variants, each of very small effect. Lo and colleagues, in Nature Genetics, published online in December 2016 and in print in 2017, identified six genomic loci reaching genome-wide significance for personality traits and showed correlations with psychiatric disorders. Our file states that the total variance explained by common variants remains small, at roughly 5 to 15 percent. That band is wrong in both directions at once, and the paper that shows why is not in our file.
Power and Pluess estimated Big Five heritability directly from common genetic variants in Translational Psychiatry in 2015, rather than inferring it from family resemblance. Neuroticism came out at 15 percent, with a standard error of 0.08 and P = 0.04, and Openness at 21 percent, P below 0.01; both reached statistical significance. Extraversion, Agreeableness and Conscientiousness did not, with point estimates of 0.08, below 0.001, and 0.01 respectively. A point estimate that fails to reach significance is not a small measured effect. It is a failure to distinguish the effect from zero. The authors' own comparison is that twin studies give around 40 to 60 percent of the variance in the Big Five while these direct estimates generally tend to be half of twin-study estimates, and they conclude that common variants account for about a quarter of the causal genetic variation. So twin designs say roughly half, direct measurement of common variants recovers a fraction of that, and for three of the five traits it recovers nothing that reaches significance at all. Neither figure is a lie. The gap between them is the finding, and nobody can fully explain it. What the field did in response was scale up: Nagel and colleagues published a meta-analysis of genome-wide association studies for neuroticism in 449,484 individuals in Nature Genetics in 2018, identifying novel loci and pathways. Six loci to nearly half a million people is what hunting variants of tiny effect actually looks like.
The biological story our file tells is Eysenck's. In The Biological Basis of Personality, published in 1967 by Charles C. Thomas of Springfield, Illinois, Eysenck proposed that extraversion is linked to cortical arousal, with introverts chronically more aroused and therefore seeking less stimulation, and neuroticism to the reactivity of the limbic system. Our file's wording for the modern evidence is careful and worth preserving exactly: partially supported by functional imaging studies showing that amygdala reactivity correlates with neuroticism. Two things need saying that our file does not say. The first is about the man. In May 2019 an enquiry at King's College London into publications Eysenck co-authored with Grossarth-Maticek concluded that 26 of them were unsafe and recommended retraction; King's made the finding public later that year, and journals subsequently retracted a set of papers and issued expressions of concern on dozens more, some of them sixty years old. That enquiry was scoped to the Grossarth-Maticek collaboration on personality and disease and deliberately excluded Eysenck's sole-authored work, and the 1967 book is not among the retracted or flagged publications. So the arousal theory is not retracted, and Eysenck's record carries the largest research-integrity finding in the history of British psychology. Both of those statements are true, and this page carries both rather than choosing one.
The second thing is about the brain, and it is a caution rather than a refutation. Avinun, Israel, Knodt and Hariri looked for associations between the Big Five traits and variability in brain grey or white matter, in NeuroImage in 2020, in a sample far larger than the earlier personality-neuroscience studies that had reported such associations, and found little evidence for them. Note the scope carefully. That is brain structure, not brain function. It does not test Eysenck's cortical-arousal account, which is a functional claim, and it does not test the task-evoked amygdala finding our file cites. What it does is put down a marker: this is one of several places on this page where a small, striking early result shrank when a large sample looked again. A well-powered null is evidence, and it is labelled as evidence here.
Refused: that personality is about 50 percent genetic, so roughly half of who you are is fixed at birth. Every clause of that misreads the statistic. A heritability estimate is a population variance figure, not a share of any individual's traits. It changes by more than a factor of two depending on whether the design compares twins or adoptive families. It moves with the environment being sampled. Direct measurement of common genetic variants recovers only a fraction of it and reaches statistical significance for two of the five traits. And heritability says nothing whatever about malleability: mean levels of the traits shift systematically with age, and life events move them further, both of which are the subject of the next section.
05What Stays the Same, and What Moves
Personality is stable, and the stability has been measured rather than assumed. Roberts and DelVecchio pooled 3,217 test-retest correlations from 152 longitudinal studies in Psychological Bulletin in 2000 and traced rank-order consistency across the lifespan: about .31 in childhood, .54 through the college years, .64 at about age 30, then a plateau near .74 between the ages of 50 and 70, with the test-retest interval held constant at 6.7 years across the whole curve. Two things make those numbers mean something rather than merely be numbers. Consistency rises with age and never reaches unity, so our file is right that the plaster metaphor, the idea that personality sets hard in early adulthood, overstates it. And that interval is not a technicality. A test-retest correlation without it is not a fact, because .74 over about seven years is a completely different statement from .74 over a lifetime. No restatement of the figure anywhere on this page travels without its interval.
Rank-order stability and mean-level change are different things and both can be high at once. Roberts, Walton and Viechtbauer pooled longitudinal studies in the same journal in 2006 and found that across the lifespan Agreeableness and Conscientiousness increase while Neuroticism decreases, with most of the movement concentrated in young adulthood, roughly ages 20 to 40; Openness increases in adolescence and declines slightly after midlife. Our file names the pattern the maturity principle: people become more socially mature with age. Everybody in a cohort can become more conscientious while keeping their position relative to everybody else, which is why these two findings do not contradict each other. Confusing them is the commonest error in popular writing about personality change, and getting it right is a real service to a reader. The mean-level finding also did not arrive uncontested: Costa and McCrae disputed it at the time and the authors' reply sits in the same volume, so this page does not present it as settled by acclamation.
Life events move personality too, and the size word is the whole claim. Bleidorn, Hopwood and Lucas reviewed life events and personality trait change in the Journal of Personality, online in 2016 and in print in 2018: a first job, marriage, divorce, widowhood and unemployment can each produce change beyond normative maturation, though the effects are typically small. Typically small is our own file's hedge and not a caution invented here, and it survives into every restatement on this page, because the compressed version of that sentence is divorce changes your personality, and that is not what the literature says.
06The Person and the Situation
Trait psychology's confidence was broken in 1968 by one book. Walter Mischel's Personality and Assessment reported that the cross-situational consistency of behaviour is typically around r = .30, a figure that became known as the personality coefficient, and argued that situations therefore matter more than traits. Two things about that number. It is not a trivially small correlation in behavioural science. And Mischel was not claiming that traits do not exist: he was claiming that a single behaviour in a single situation is poorly predicted by a trait score, which is true, and which improves sharply as soon as behaviour is aggregated across many situations.
The resolution most researchers now accept is interactionist: behaviour is jointly determined by personality traits and situational demands, and traits predict behaviour aggregated across many occasions rather than any single one. The better half of the story is that the man who broke trait psychology's confidence supplied the repair. Mischel and Shoda's Cognitive-Affective Processing System model, in Psychological Review in 1995, showed that individuals are consistent in their if-then situation-behaviour profiles: consistent in which situations produce which behaviour, even when the raw behaviour looks inconsistent. Consistency lives in the pattern, not in the average. That is the best single idea in this section and it is worth more than the coefficient it succeeded.
Funder stated the settlement plainly in the Journal of Research in Personality in 2006: the trait approach and the social-cognitive approach are complementary rather than competing. Traits describe what people typically do. Cognitive-affective units explain how they do it. Neither answers the other's question, and treating the pair as rivals was the error.
07What It Predicts, and by How Much
Our file's summary asserts significant predictive validity for life outcomes including health, longevity, occupational performance, relationship quality and psychopathology, and then supplies not one number for any of them anywhere in the document. Here is the shape of that literature. Barrick and Mount meta-analysed 117 studies in Personnel Psychology in 1991, across five occupational groups (professionals, police, managers, sales, and skilled and semi-skilled workers) and three criteria (job proficiency, training proficiency and personnel data). Conscientiousness was the only Big Five dimension showing consistent relations with all job performance criteria across all occupational groups. Extraversion was a valid predictor for the two occupations involving heavy social interaction, management and sales. For the remaining dimensions the estimated true-score correlations varied by occupational group and by criterion type. No coefficient from that paper appears on this page, and the reason is worth stating: three different figures for the same finding circulate in secondary sources, the difference between them is which corrections were applied, and the primary text was not read for this article.
Then the correction, which is recent and large. Sackett, Zhang, Berry and Lievens revisited meta-analytic estimates of validity in personnel selection in the Journal of Applied Psychology in 2022 and argued that all five standard approaches to correcting for range restriction produce substantial overcorrection. Their conclusion, in the published abstract's own words: most of the same selection procedures that ranked high in prior summaries remain high in rank, but with mean validity estimates reduced by .10 to .20 points; structured interviews emerged as the top-ranked selection procedure; and selection predictor-criterion relationships are considerably lower than previously thought. This is not a correction aimed at personality measures specifically. It hits cognitive ability tests the same way. What it means for this article is that a sentence of the form conscientiousness predicts job performance either carries a size word or explains why it does not, as the 1991 meta-analysis above does, and where a 2022 estimate exists, the size word is modest.
The best single answer to the replication question in this field points both ways at once, which is why it is the honest headline. The Life Outcomes of Personality Replication Project ran preregistered, high-powered replications of 78 previously published trait-outcome associations, with a median sample of 1,504, and reported in Psychological Science in 2019 that 87 percent of the attempts came out statistically significant in the expected direction, with the replication effects typically 77 percent as strong as the corresponding originals. Read both halves. Against the reflex that all of psychology collapsed in the replication crisis: these findings mostly held, at a rate most areas of the field would envy. Against overstatement: they held smaller, by about a quarter, which is the standard signature of publication bias in the original literature. One result, two disciplines.
Roberts, Kuncel, Shiner, Caspi and Goldberg compared personality traits against socioeconomic status and cognitive ability as predictors of mortality, divorce and occupational attainment in Perspectives on Psychological Science in 2007, and argued that the predictive power of personality traits is comparable in magnitude to that of the other two for several consequential life outcomes. The paper is called The Power of Personality, and the title will do the overstating for a reader who is not careful. What it says is that personality predicts about as well as socioeconomic status and cognitive ability do. The corollary, which belongs in the same breath, is that none of the three predicts these outcomes very strongly. It is a statement about relative standing among weak predictors.
One domain beyond work, because a single literature is a poor calibration. Poropat meta-analysed the five-factor model against academic performance in Psychological Bulletin in 2009 and found conscientiousness the strongest and most consistent Big Five predictor of academic achievement, with a relationship large enough to rival intelligence at secondary and tertiary level in some of the pooled data. The same size discipline applies. And this meta-analysis predates the correction argument above, which concerned personnel selection specifically but raises the same class of question about correction practice generally.
The most useful thing a good taxonomy does is catch a repackaged construct, and our own file's counter-argument table records the Big Five doing exactly that. Crede, Tynan and Harms meta-analysed the grit literature in the Journal of Personality and Social Psychology in 2017 and found grit overlapping with the perseverance-of-effort component of conscientiousness at rho = .84. That rho denotes a disattenuated correlation, corrected for the unreliability of both measures; an uncorrected correlation between two scales could not approach .84 given their reliabilities. Grit, sold as a distinct predictor of success, is very largely conscientiousness under a newer name. A framework that can establish that is earning its keep, and it is worth noticing that our file puts the result in its own counter-arguments table rather than leaving it out.
08A Rival Model, and What a Factor Actually Is
There is a serious rival and it is not a fringe one. Ashton and Lee proposed HEXACO in Personality and Social Psychology Review in 2007: a sixth factor, Honesty-Humility, covering sincerity, fairness, greed avoidance and modesty, derived from lexical studies in multiple languages where six factors emerged more naturally than five. HEXACO is not the Big Five plus one. Its Agreeableness and its Emotionality differ from Big Five Agreeableness and Neuroticism in how the content is allocated between them, and Ashton, Lee and de Vries set that reallocation out themselves in 2014, which is the part our file states without explaining.
Our file states that Honesty-Humility is the strongest predictor of workplace counterproductive behaviour, at about r = -.40, and that it correlates negatively with Dark Triad traits. That number belongs to a study rather than to the world: Lee, Ashton and de Vries reported it in Human Performance in 2005, predicting workplace delinquency and integrity from the HEXACO and five-factor models. Three cautions travel with it. One correlation, for one predictor, against one criterion, in one literature, is not a settled ranking. The HEXACO group also built the scale. And self-report predictors of self-reported misconduct share method variance, which inflates the association between them for reasons that have nothing to do with either construct. Set that beside section 07, where the whole personnel-selection validity literature was revised downward for correction artefacts.
The debate our file states is whether HEXACO represents a genuine improvement over the Big Five or merely a rotation of the same factor space, with Big Five proponents arguing that Honesty-Humility content is partially captured by low Agreeableness. That word rotation is the most useful thing in this article. A factor solution is not a discovery of parts. It is a set of axes drawn through a cloud of correlations, and the axes can be turned. Different placements describe the same cloud, and the reason five became standard is that five kept replicating across samples, methods and laboratories, not that anybody ever found five objects. On that reading HEXACO is not a heresy but a different placement of the axes with a case behind it, and Saucier's independent finding of six recurrent dimensions in inclusive lexical studies strengthens that case from outside the HEXACO group. Our own file lists HEXACO as the counter to the claim that the Big Five is the optimal personality taxonomy, which is exactly the right place for it.
09The Dark Triad, and Whether It Is Anything New
Paulhus and Williams named the Dark Triad in the Journal of Research in Personality in 2002: narcissism, meaning grandiosity, entitlement and a need for admiration; Machiavellianism, meaning strategic manipulation, cynicism and a pragmatic morality; and psychopathy, meaning callousness, impulsivity and antisocial behaviour. The three are conceptually distinct and empirically correlated with each other at roughly r = .25 to .50, which is the first hint that they may not be three separate things.
Our file records that Dark Triad traits predict workplace deviance, unethical behaviour, short-term mating strategies and interpersonal aggression, and gives no effect size for any of the four. Read predicts at the size everything else on this page has established: a modest correlation in a self-report literature, not a determination of anything about anybody. Section 07 is the calibration for that word, and it applies here without amendment.
Our file's own stated debate is the interesting part: whether the three Dark Triad traits are truly distinct from each other and from the Big Five at all, given that low Agreeableness combined with low Conscientiousness captures substantial variance in all three. The file also records the Dark Tetrad, which adds everyday sadism as a fourth dimension following Buckels, Jones and Paulhus in Psychological Science in 2013, and it flags measurement concerns with the brief self-report Dark Triad scales. So the concession is already on the record in our own corpus: the Dark Triad may be a rebranding of one corner of the five-factor space rather than a discovery beyond it. That matters, because this is the part of the subject most likely to reach a reader through popular media in the shape of a diagnosis. Nothing here is a diagnosis, and clinical psychopathy is a different subject with a different literature.
10Two Instruments Built on Opposite Principles
One contrast first, because it separates two objects that share a name. The Minnesota Multiphasic Personality Inventory, begun by Hathaway and McKinley in the 1940s, and its successors are the most widely used clinical personality measures. Our file gives the MMPI-2 at 567 items and the MMPI-3, updated in 2020, at 335 items; the publisher's own record confirms 335 true-false items across 52 scales, with a normative sample of 810 men and 810 women aged 18 and over matched to United States Census Bureau demographic projections, the first update since the mid-1980s. Its validity scales are empirically keyed to detect response distortion, which is to say faking good or faking bad. Our file records strong evidence for clinical use alongside criticism for item-content overlap and changing norms. The MMPI is not a Big Five instrument and this page does not present it as one. Its role here is the contrast in design philosophy: a clinical inventory built by empirically keying items against diagnosed groups, against a trait model built by factor-analysing the structure of ordinary language. Two completely different objects, both called a personality test.
Now the instrument most readers have actually taken. The Myers-Briggs Type Indicator has poor psychometric properties despite its popularity, and our file names three specific problems: low test-retest reliability for the type classifications, the information thrown away by cutting continuous dimensions into dichotomies, and a four-factor structure that does not replicate in factor analyses as cleanly as Big Five models do. The retest figure needs its range and its source, and our file supplies neither. Pittenger's 1993 review in Review of Educational Research cites a study in which 50 percent of subjects were reclassified on one or more of the four scales across a five-week interval. His 2005 review reports the wider literature as giving somewhere between 39 percent and 76 percent changing at least one letter on retest, depending on the interval and the sample. So the honest statement is a range with a most-cited point inside it, not a bare one in two.
The reason for that instability is the design, and stating it precisely is the clearest way to see what a continuous dimension is. The Big Five gives every person a position on each of five continua, and the distributions are unimodal, which means most people sit somewhere near the middle rather than clustering at two ends. The Myers-Briggs takes four continua and cuts each into two boxes. A person near the middle of a scale therefore flips category on a trivial change of mood or item wording, comes out with a different four-letter type, and nothing about them has changed. That is not carelessness by the people who use it. It is what necessarily happens when a cut point is imposed on a distribution that has no natural gap in it. And our own file's own cited paper makes the point without hostility: McCrae and Costa, in the Journal of Personality in 1989, reinterpreted the Myers-Briggs from the perspective of the five-factor model, mapped its four scales onto four of the five factors, and found them meaningful as continuous measures while rejecting the type dichotomies. The four scales are measuring something. The sixteen boxes are the problem.
Our file records the instrument's popularity in business and career counselling at roughly two million administrations a year. That figure is a publisher's estimate. It originates with the company that acquired the rights in 1975, is repeated through the manual and from there into the academic and popular literature, and no independent audit of it was located for this page. So it is carried here as what it is, an estimate by the party that sells the instrument, rather than as a measured statistic. In an article whose subject includes the difference between commercial personality typing and psychometrics, that distinction matters more than it usually would.
Refused: that the Big Five is basically a better Myers-Briggs, five personality types instead of sixteen. The Big Five has no types at all. It has five continuous dimensions on which every person sits somewhere, usually not far from the middle, and there is no defensible cut point that turns a score into a category. Which cuts against this article too: a page that describes somebody as high in openness, full stop, as though that named a kind of person, has quietly reintroduced the error it is criticising. Nor is a Big Five profile a fixed portrait. Rank-order consistency plateaus near .74 over a 6.7-year interval and never reaches unity, and mean levels shift systematically with age.
11At the Edge of the Map, and Off It
Our file places digital personality assessment at its speculative tier and the placement is right. Youyou, Kosinski and Stillwell reported in the Proceedings of the National Academy of Sciences in 2015 that a model trained on Facebook Likes predicted a person's Big Five scores at r = 0.56, against r = 0.49 for that person's own Facebook friends filling in a personality questionnaire about them. The thresholds are the arresting part: 10 Likes to beat a work colleague, 70 to beat a cohabitant or friend, 150 to beat a family member, 300 to beat a spouse. Participants averaged 227 Likes. Now the sentence that almost never travels with that study. Both the computer and the human judges were scored against the target's own self-report. The self-report is the yardstick, so what the study shows is that the model matches what you say about yourself better than your friends do. It is not a demonstration that an algorithm knows you better than you know yourself, and our file's flags on generalisability, privacy and misuse are the right ones to keep.
Politics is the other entry at that tier, and the numbers need replacing. Our file reports Openness correlating with liberal political orientation at about r = .30 and Conscientiousness with conservatism at about r = .20, citing Carney and colleagues in Political Psychology in 2008, while noting that causal direction, mediating mechanisms, and whether these reflect genuine traits or politically tinged self-presentation all remain debated. Sibley, Osborne and Duckitt meta-analysed 73 studies covering 71,895 people in the Journal of Research in Personality in 2012 and report Openness at r = -.18 with political conservatism and Conscientiousness at r = .10 with conservatism, both of which their own framing calls significant but weak. That is roughly half our file's figures in both cases, which is the classic shape of a single-study headline that shrank when the studies were pooled. And the more important result in that meta-analysis is neither point estimate. The Openness relationship is strongly moderated by systemic threat and uncertainty, indexed by national homicide and unemployment rates: it reaches r = -.42 where systemic threat is low and falls to a negligible r = -.07 at only moderate levels of threat. A relationship that swings that far with national circumstance is not a constant of human nature.
Two taxonomies have been tested properly and failed, and they belong in the body of this article rather than in a footnote, because they show what failure looks like against a background where the five-factor structure largely held. Blood type personality theory, widely believed in Japan and South Korea, holds that ABO blood type determines personality: Type A earnest, Type B creative, Type O confident, Type AB rational. Rogers and Glendon tested it in Personality and Individual Differences in 2003, and Nawata tested it again with large-scale surveys in Japan and the United States in 2014. Studies with more than 10,000 participants find no meaningful relationship between blood type and personality. This is not a subject for mockery. It is a live belief system in two large countries with documented consequences in employment and dating, and it is a clean demonstration of what it looks like when a personality taxonomy is tested and does not survive.
The same for astrology. There is no credible evidence that birth date or zodiac sign predicts personality traits, and Hartmann, Reuter and Nyborg examined the relationship between date of birth and individual differences in personality and general intelligence in a large-scale study in Personality and Individual Differences in 2006. Our file records studies with more than 15,000 participants finding no significant differences in Big Five scores by sun sign, and attributes any self-reported effects to confirmation bias and the Barnum or Forer effect: a description vague enough to fit everybody reads as uncannily personal. That mechanism is worth naming for an uncomfortable reason as well as a comfortable one. It is a risk the Big Five runs too, in popular presentation, and an article unwilling to say so is not being straight with its reader.
12The Objection to the Premise
The deepest objection to the Big Five is not about any of its findings. It is about the premise section 01 stated, and our own file does not mention it. Jack Block's A Contrarian View of the Five-Factor Approach to Personality Description, in Psychological Bulletin in 1995, makes four objections and every one of them survives being stated plainly. The lexical hypothesis assumes that what matters about personality is what lay language happened to encode, which is a strong and unargued premise. The number of factors recovered is not discovered but is a consequence of the variables selected, the sample used and the rotation chosen. The resulting five are broad to the point of being uninformative about any individual. And factor-analysing adjectives can recover the structure of raters' implicit personality theories rather than the structure of personality itself. Block returned to the argument six years later, and the exchange is on the record on both sides: Costa, McCrae, Goldberg and Saucier all replied in print in the same 1995 volume, and Block published a rejoinder to them.
Take the premise seriously for a moment, because it is more interesting than its critics or its users usually allow. It says that if a difference between people matters enough, some language will have coined a word for it, so counting and sorting the words is a way of surveying the space of personality. Put that way, three problems are visible without any statistics at all. It privileges what is socially salient over what is causally important: a language coins words for the differences its speakers need in order to gossip, judge, hire and marry, and there is no guarantee that this is the same set as the differences that actually drive behaviour. It can only ever find what a language has already lexicalised. And it delivers a description rather than an explanation, because the Big Five says what varies and not why. None of that makes the five factors false. All of it constrains what they can be evidence for.
| The Claim | The Counter, In Our Own File's Words | Where This Page Carries It |
|---|---|---|
| Big Five is the optimal personality taxonomy | HEXACO 6-factor model may better capture Honesty-Humility (Ashton and Lee, 2007) | Section 08, carried unresolved. The rotation argument is what makes HEXACO a rival rather than a heresy |
| Traits are consistent across situations | Cross-situational consistency is modest, r = about .30 (Mischel, 1968) | Section 06, with the qualification Mischel himself made: aggregating across many situations improves prediction sharply |
| MBTI is valid personality assessment | Poor test-retest reliability; continuous traits forced into dichotomies (McCrae and Costa, 1989) | Section 10, with the retest range restored and with the same paper's finding that the four scales are meaningful as continuous measures |
| Personality is primarily genetic | ~50% non-shared environment + error; epigenetics (Vukasovic and Bratko, 2015) | Section 04, where the measurement-error half of that phrase is given its due rather than passed over |
| Grit is distinct from conscientiousness | Meta-analysis shows rho = .84 overlap with perseverance facet (Crede et al., 2017) | Section 07, as the clearest single case of the taxonomy doing discriminative work |
Refused: that personality testing is pseudoscience, the Big Five included, and none of it predicts anything. This is the mirror error and it gets refused as firmly as the first one. The five-factor structure is recovered repeatedly from independent methods: self-report, peer rating, lexical analysis and language use. Rank-order consistency rises to about .74 by later middle age, over a 6.7-year interval. A preregistered, high-powered replication project found 87 percent of 78 published trait-outcome associations replicating in the expected direction, at about 77 percent of the original effect size, which is a record most areas of psychology would envy. And the model does real discriminative work: it is what showed that grit is very largely conscientiousness renamed. The correct verdict is neither proven universal nor junk. It is a well-replicated descriptive taxonomy with modest, real predictive validity, an unresolved cross-cultural boundary, and an explanatory story it does not yet have.
Fast Facts
- Where The Five Came From
- Not from a theory of mind. From the lexical hypothesis: the premise that differences between people which matter get encoded in a language's everyday vocabulary. Galton counted character words in a thesaurus in 1884, Allport and Odbert sorted about 4,500 stable trait terms out of an English dictionary in 1936, Cattell compressed the list to 16 factors that would not replicate across laboratories, and Tupes and Christal recovered five recurrent factors in a United States Air Force technical report in 1961
- What A Factor Solution Is
- A set of axes drawn through a cloud of correlations, not a discovery of parts. The axes can be turned, different placements describe the same cloud, and five became standard because five kept replicating across samples, methods and laboratories. That is why HEXACO's sixth factor is a coherent rival rather than a heresy
- The Cross-Cultural Boundary
- McCrae and Costa (1997) analysed six translations of one inventory, 7,134 participants, five language families. The five-factor model was not supported among the Tsimane of the Bolivian Amazon (Gurven and colleagues, 2013), and a re-analysis of that same dataset by an overlapping team reached a different conclusion in 2018. Twenty-three low- and middle-income countries, 29 surveys and 94,751 respondents did not pass standard validity tests on the usual question sets (Laajaj and colleagues, 2019). Some lexical studies recover six or seven factors rather than five. Whether that is a limit on the structure or on the questionnaire is unsettled
- Heritability, Read Correctly
- A population variance statistic, not a share of any individual. Pooled twin designs give slightly below .50, family and adoption designs slightly above .20, and all designs pooled about 40 percent (Vukasovic and Bratko, 2015). Measured directly from common genetic variants, only neuroticism at about 15 percent and openness at about 21 percent reached statistical significance; the other three did not (Power and Pluess, 2015). Shared environment contributes roughly 0 to 11 percent, and what is left is non-shared environment plus measurement error
- Stability, With Its Interval
- Rank-order consistency rises from about .31 in childhood to about .54 in the college years, about .64 near age 30, and a plateau near .74 between ages 50 and 70, all at a constant test-retest interval of 6.7 years and never reaching unity (Roberts and DelVecchio, 2000). Separately, mean levels move: agreeableness and conscientiousness rise and neuroticism falls, mostly between roughly ages 20 and 40. Life events produce further change, though the effects are typically small
- Predictive Validity, With A Size Word
- Conscientiousness was the only Big Five dimension showing consistent relations with all job performance criteria across all occupational groups (Barrick and Mount, 1991; no coefficient from that meta-analysis is printed on this page). In 2022 the whole personnel-selection literature was revised downward by an estimated .10 to .20 points for systematic overcorrection (Sackett and colleagues). A preregistered replication project found 87 percent of 78 trait-outcome associations replicating, at about 77 percent of original strength (Soto, 2019)
- The Grit Result
- Grit overlaps with the perseverance-of-effort component of conscientiousness at a disattenuated meta-analytic rho of about .84 (Crede, Tynan and Harms, 2017). Which is to say a construct sold as a distinct predictor of success is very largely conscientiousness renamed, and catching that is what a good taxonomy is for
- Not The Myers-Briggs, And The Difference Is Of Kind
- The Big Five has no types: five continuous dimensions, unimodal distributions, most people near the middle, no defensible cut point. The Myers-Briggs cuts four continua into two boxes each, which is why studies report roughly 39 percent to 76 percent of people changing at least one letter on retest, with the most cited figure near half over a five-week interval (Pittenger, 1993 and 2005). McCrae and Costa (1989) found the four scales meaningful as continuous measures while rejecting the dichotomies, and that is the fair reading
- The Two Million Figure
- About two million administrations a year is a publisher's estimate, originating with the company that acquired the rights in 1975 and repeated onward from the manual. No independent audit of it was located for this page, so it is attributed rather than asserted
- What This Page Declines Or Rescopes From Our Own File
- The more-than-fifty-cultures scope, attached to a paper that studied six translations (section 03). The inference from the gender-difference finding to biological contributions, carried here as one reading among at least two (section 03). Our file's five per-trait heritability percentages, attributed to a meta-analysis that does not report them; their origin could not be identified and that set is not printed here, though one named twin study's per-trait figures are, and they are different numbers (section 04). The 5 to 15 percent band for common-variant heritability, which is too low for openness and too generous for three traits where the estimate did not reach significance (section 04). The bare 50 percent Myers-Briggs retest figure, given its real range and its source (section 10). The roughly two million administrations, re-attributed to the publisher (section 10). And the political correlations our file gives as about r = .30 and about r = .20, against meta-analytic figures of about -.18 and about .10 across 73 studies (section 11)
- What Our Own File Leaves Out, Supplied Here
- Tupes and Christal, who recovered the five two years before the paper our file starts with (section 02). What a heritability estimate actually is, which our sibling file T_1_10 carries and this one does not (section 04). The 2019 King's College London enquiry into publications Eysenck co-authored, which found 26 of them unsafe and which does not touch the 1967 book cited here (section 04). And any number at all for the predictive validity our file asserts across five life domains (section 07)
- What Was Not Read
- Most of this literature was read at the level of a resolved bibliographic record and a published abstract rather than in full. No coefficient from Barrick and Mount appears here because three different figures for the same finding circulate, the difference between them is which corrections were applied, and the primary text was not read for this article. Eysenck's 1967 book is cited in prose by author, title, year and publisher, with no identifier, because none could be verified
- Refused In Both Directions
- That the Big Five is a human universal found in every culture, which the Tsimane result, the non-WEIRD instrument failures, the six-and-seven-factor lexical studies and the misattributed fifty-culture figure all forbid. And that personality testing is pseudoscience that predicts nothing, which the repeated recovery of the structure from independent methods, the stability curve, the replication project and the grit result all forbid
What We Can Actually Stand Behind
Five broad dimensions come back repeatedly when trait ratings are factor-analysed, and they come back from independent methods: self-report questionnaires, peer and behavioural ratings, lexical studies and linguistic analysis of social media text. It is the dominant taxonomic framework in the field, and it earned that position by replicating where Cattell's sixteen factors did not. What that establishes is a descriptive taxonomy that reproduces, which is a real achievement and a narrower claim than it is usually made to carry.
The five-factor structure replicates well and repeatedly in large, literate, industrialised, questionnaire-taking populations. The paper our own file credits with more than fifty cultures across six continents analysed six translations of one inventory with 7,134 participants; a genuine fifty-culture study exists, dates from 2005, and uses observer ratings rather than self-reports. Both are real results. Neither is a census of humanity.
Personality is stable and becomes more so with age without ever becoming fixed. Rank-order consistency runs from about .31 in childhood to a plateau near .74 between ages 50 and 70, at a test-retest interval held constant at 6.7 years, and it never reaches unity. Separately and compatibly, mean levels move: agreeableness and conscientiousness rise, neuroticism falls, most of it between roughly ages 20 and 40. Those are two different findings and both hold.
Twin studies put heritability for all five factors in a moderate band, roughly 40 to 60 percent, and pooled across designs the meta-analytic estimate is about 40 percent. The design matters more than the point estimate: twin designs give slightly below .50, family and adoption designs slightly above .20. Measured directly from common genetic variants, only two of the five traits reached statistical significance. Heritability is a population variance statistic, it moves with the environment sampled, and it says nothing about whether a trait can change.
Whether five is the right number is a live question in print. Some lexical studies recover six or seven factors rather than five; Saucier concluded in 2009 that inclusive lexical studies point to six recurrent dimensions; and HEXACO adds Honesty-Humility with a case behind it, while Big Five proponents argue the content is partially captured by low Agreeableness. The dispute is best understood as being about where to place the axes rather than about how many things exist, and nothing here settles it.
Trait-outcome relationships are genuine and they are small to moderate. Conscientiousness was the only dimension showing consistent relations with all job performance criteria across all occupational groups in the 1991 job-performance meta-analysis, and conscientiousness is also the strongest Big Five predictor of academic achievement in the 2009 pooling. Then in 2022 the whole personnel-selection literature was argued to have been systematically overcorrected for range restriction, with mean validity estimates reduced by an estimated .10 to .20 points. Every size given above for a trait-outcome relationship is real rather than assumed, and where our own file supplies none, as with the 1991 meta-analysis above, this page says so and why; where more than one estimate exists, the direction of revision has been downward.
Two lines of work sit at our own file's speculative tier and this page does not upgrade either. Algorithmic prediction of trait scores from social media behaviour is real and its striking comparison is against human informants, with the target's own self-report serving as the yardstick for both, which is not the same claim as the one usually reported. And the link between personality and political ideology is weak, contested in its causal direction, and strongly moderated by national circumstance in the one meta-analysis of it carried here.
No, the Big Five is not established as a human universal. The five-factor model was not supported among the Tsimane on tests of internal consistency, response stability or external validity, and a re-analysis of that same dataset by an overlapping team reached a different structural conclusion, which leaves the case open rather than closed in either direction. Twenty-three low- and middle-income countries, 29 surveys and 94,751 respondents did not pass standard validity tests on the usual question sets, and the authors of that study scope their conclusion to the instruments rather than to the people. Several lexical studies recover six or seven factors. Whether the boundary is a property of the structure or of the questionnaire is unsettled, and this page leaves it there.
No, personality is not about half fixed at birth. A heritability estimate is a population variance statistic and not a share of anybody's traits; it changes by more than a factor of two depending on whether the design compares twins or adoptive families; it moves with the environment being sampled; direct measurement of common genetic variants recovers only a fraction of it and reaches significance for two traits out of five; and high heritability is entirely compatible with change, which is what the age curve and the life-events literature both show.
No, the Big Five is not a better Myers-Briggs with five types instead of sixteen. It has no types. Five continuous dimensions, unimodal distributions, most people near the middle, and no defensible cut point that converts a score into a category. The retest instability of a type indicator is the arithmetic consequence of imposing a cut on a distribution with no gap in it, which is also why the fair reading of the Myers-Briggs is the one its own critics reached in 1989: the four scales measure something as continuous scales, and the sixteen boxes are the defect.
No, and in the other direction: this is not pseudoscience and it does not predict nothing. The structure is recovered from independent methods, the stability curve is measured rather than asserted, a preregistered high-powered replication project found 87 percent of 78 trait-outcome associations replicating in the expected direction at about 77 percent of original strength, and the framework was strong enough to show that grit is very largely conscientiousness renamed. Refusing the overclaim and refusing the dismissal are the same act of discipline.
No to blood type and no to astrology, and both are at our own file's own grade. Studies with more than 10,000 participants find no meaningful relationship between ABO blood type and personality, and studies with more than 15,000 participants find no significant differences in Big Five scores by sun sign. Neither belongs in a footnote: they are what a personality taxonomy looks like when it is tested and does not survive, which is the correct background against which to read a taxonomy that largely did.
What the Big Five is, at the end of all that, is a very good map of one thing and a silence about another. It says what varies between people, in five directions that keep coming back out of self-reports, peer ratings and the vocabulary of a language, and it says it well enough to expose a repackaged construct and to predict, modestly, how a life goes. It does not say why the five are five. It has not shown how far past the questionnaire-taking world it travels. And the premise underneath it leaves a question the model cannot answer from inside itself. The map was drawn by counting the words a language kept, and languages keep words for the differences their speakers needed to notice. A difference nobody needed to notice would have left no word behind, and so no factor, and so no place on the map at all. What is missing from it, and how would we ever find out?
Sources & further reading
This article was written from one file in our own research library, T_1_08, Personality Psychology and the Big Five. That file is where the work started; it is not where the work can be checked. The 56 external entries below are where it can be checked: 52 works cited by digital object identifier, one book cited by ISBN and verified against Open Library, one primary-source archive scan of an 1884 essay, one official publisher record for a test instrument, and one university's own statement about a research-integrity enquiry, each named with the section it supports and the claim it carries there. A second corpus file, T_1_10, Psychometrics and Intelligence Testing, is linked at the end for exactly one thing, the definition of heritability that T_1_08 lacks, and it is not counted in the badge at the head of this page, which names one research file because one is what this article was built from. Four things are better said plainly here than left for a reader to discover. First, where this page departs from our own file, all of it argued in the open above rather than corrected silently. It declines or rescopes seven statements: the claim of replication in more than fifty cultures across six continents, attached to a paper that analysed six translations of one inventory with 7,134 participants (section 03); the inference from the gender-difference finding to biological contributions, carried here as one reading among at least two with the reference-group effect named as the other (section 03); the five per-trait heritability percentages our file attributes to a 2015 meta-analysis that does not report them, whose origin could not be identified and which therefore appear nowhere on this page, the heritability table carrying instead a named single twin study whose per-trait figures are different numbers (section 04); the 5 to 15 percent band for the variance explained by common genetic variants, which is too low for openness and too generous for the three traits whose estimates did not reach significance at all (section 04); the bare 50 percent Myers-Briggs retest figure, replaced by the range of roughly 39 to 76 percent with its most cited point near half over a five-week interval, and given its sources (section 10); the roughly two million annual administrations, re-attributed to the publisher whose estimate it is (section 10); and the political correlations of about .30 and about .20 from a single 2008 study, set against meta-analytic figures of about -.18 and about .10 across 73 studies and 71,895 people (section 11). It supplies four things the file leaves out: Tupes and Christal, who recovered five recurrent factors in 1961, two years before the paper our file's discovery story starts with (section 02); what a heritability estimate actually is, which our sibling file T_1_10 carries and T_1_08 does not (section 04); the 2019 King's College London enquiry that found 26 publications Eysenck co-authored with Grossarth-Maticek unsafe, together with the fact that the enquiry excluded his sole-authored work and does not touch the 1967 book cited here (section 04); and any number at all for the predictive validity T_1_08 asserts across five life domains and never quantifies (section 07). Second, three bibliographic defects in that same file, recorded here rather than in the body because they are bibliographic rather than substantive. Its bibliography cites the 1992 professional manual for the Revised NEO Personality Inventory with an identifier that resolves to a 2004 test-record entry for a different and shorter instrument, so the entry below ships the 1995 peer-reviewed paper on the domain-and-facet hierarchy instead. Its body cites a 2018 Bleidorn paper for the life-events claim while its bibliography carries a different Bleidorn paper from 2019 on policy relevance, so the entry below ships the life-events paper the body is actually citing. And its ISBN for Mischel's Personality and Assessment is a real identifier for the 2013 Psychology Press reissue while the line describes the 1968 Wiley first edition, so the entry below says which object the link opens. Several further works are cited in the file's body or its counter-arguments table with no entry in its bibliography at all; identifiers for those are supplied in the list below. Third, what was not read. Most of this literature was read at the level of a resolved bibliographic record and a published abstract rather than in full. No coefficient from Barrick and Mount is printed anywhere on this page: three different figures for the same finding circulate in secondary sources, the difference between them is which statistical corrections were applied, and the primary text was not read for this article. Eysenck's The Biological Basis of Personality is cited in prose by author, title, year and publisher and carries no identifier below, because no identifier for the 1967 first edition could be resolved against its own record during the research for this page, and an identifier that could not be resolved does not get shipped here. Fourth, two notes on the list itself. The 2008 paper by Schmitt and colleagues on sex differences across 55 cultures carries a published correction in the same journal; a correction is not a retraction, the 2008 paper is cited here for the replicated paradox, and the corrected record is noted in its entry. And the Revised NEO Personality Inventory and the Myers-Briggs Type Indicator are both copyrighted commercial instruments: neither one's item text, scoring key or profile sheet is reproduced anywhere on this page.
Image credits
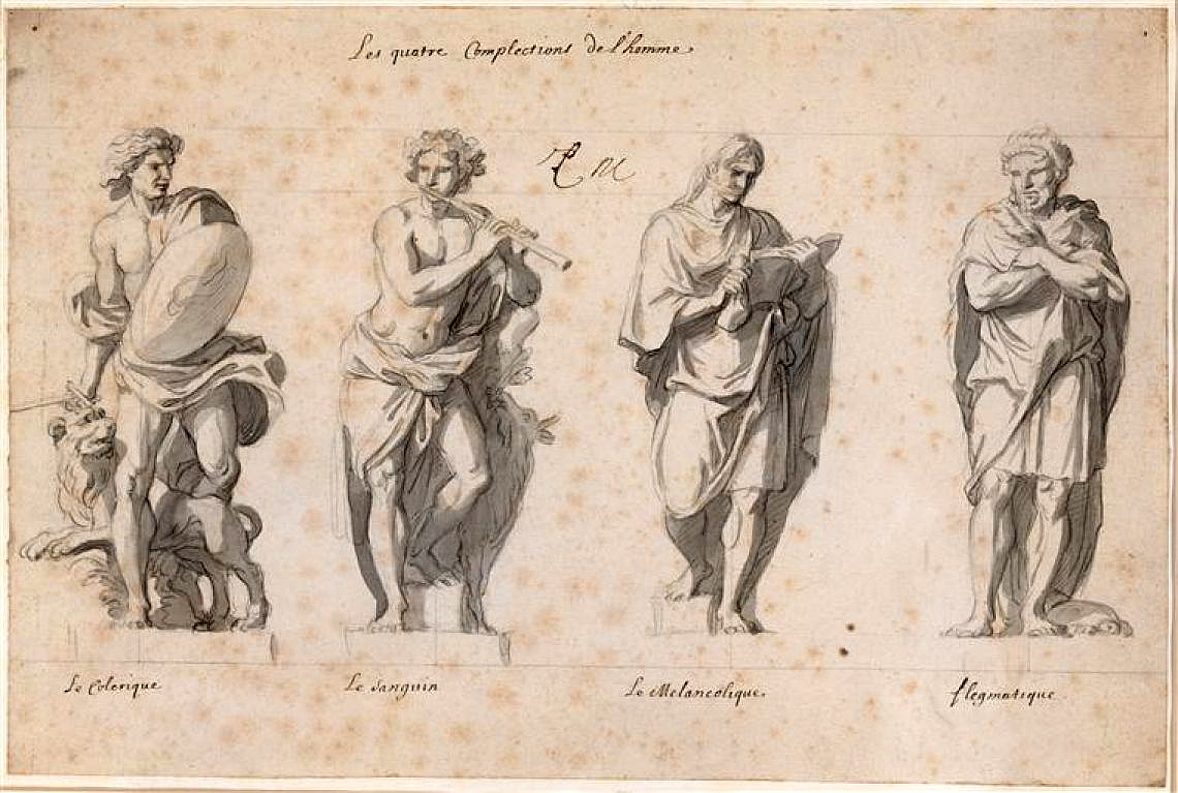
- A seventeenth century pen and wash drawing of the four temperaments as four standing figures, each labelled by hand beneath it Charles Le Brun (1619 to 1690), pen drawing, seventeenth century; Chateau de Versailles, accession MV7907 and INVDessins41; the file page's Author field reads Charles Le Brun and its Credit field reads RMN (Reunion des musees nationaux), via Wikimedia Commons. Public Domain Source.
- A diagram of the five trait names arranged in a ring around a central label reading Personality Original: Anna Tunikova for peats.de and wikipedia; Vector: EssensStrassen, via Wikimedia Commons; rasterised here from the source SVG and flattened onto white. CC BY 4.0 Source.
- Card crop of A seventeenth century pen and wash drawing of the four temperaments as four standing figures, each labelled by hand beneath it Charles Le Brun (1619 to 1690), pen drawing, seventeenth century; Chateau de Versailles, accession MV7907 and INVDessins41; the file page's Author field reads Charles Le Brun and its Credit field reads RMN (Reunion des musees nationaux), via Wikimedia Commons. Public Domain Source.

