
The Carrington Event: The Solar Storm That Set the Wires on Fire
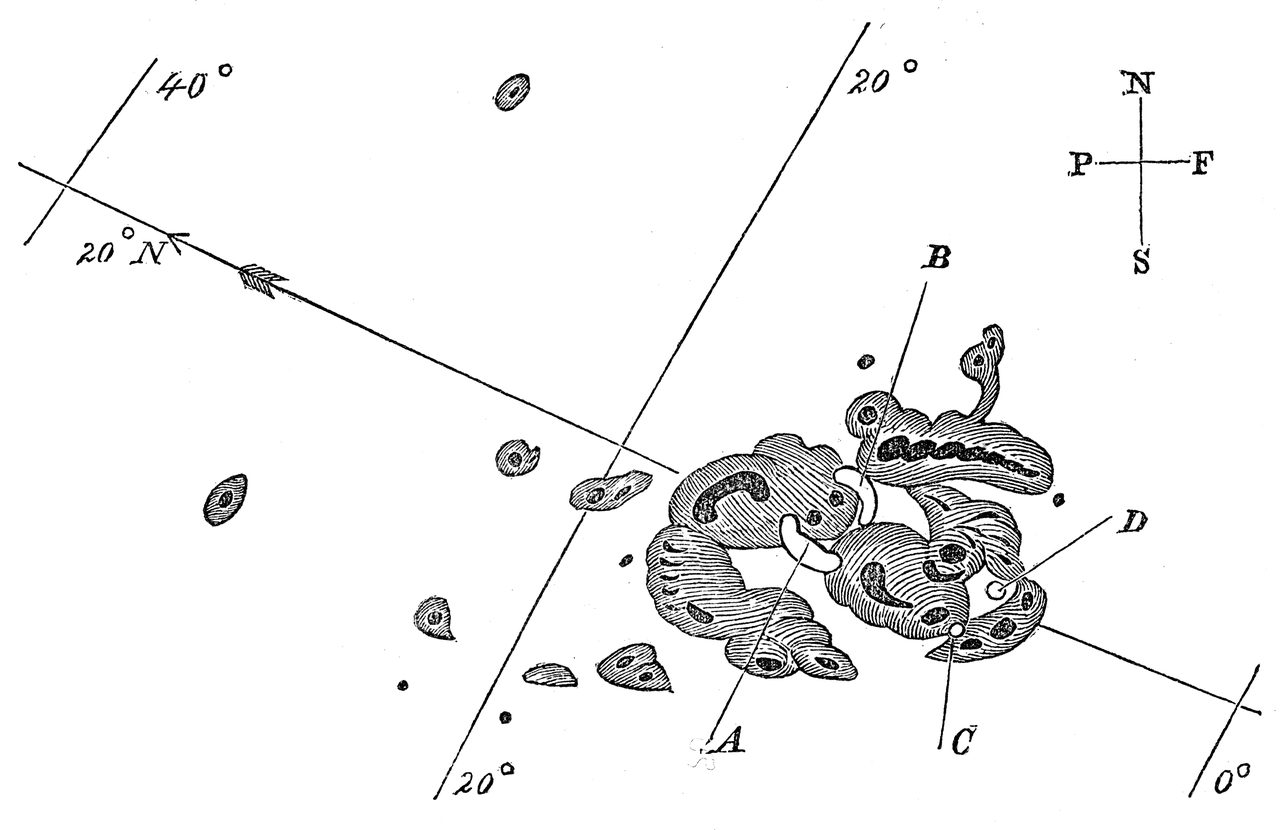
On September 1, 1859, two astronomers independently watched a patch of the Sun flare white. About seventeen and a half hours later a severe geomagnetic storm broke. The aurora reached the tropics, telegraph operators took shocks off their keys, paper caught fire in the offices, and some lines went on working with their batteries disconnected. That much is very well evidenced. What the same storm would do to a wired planet is where the literature comes apart, and the figures most often quoted for it turn out to belong to other storms, other countries and other papers. This is the file, opened claim by claim.
The 1859 storm is one of the best evidenced events in this wing. Two astronomers watched the flare. Observatories on several continents recorded the magnetic disturbance. Newspapers printed the aurora. Telegraph operators wrote down what their instruments were doing while the instruments were doing it. Almost none of the argument is about 1859. The argument is about now: what the same storm would do to a planet that has wired itself, what that would cost, and how likely it is in any given decade. Those are the numbers that get quoted, and they are the softest things in the file. Our own research document carries three of them wrongly, and this article says which three and how. Let's open the file.
01The First Flare Anyone Ever Saw
Start with what was seen, because it was seen unusually well for 1859, and because nothing in this section is in dispute.
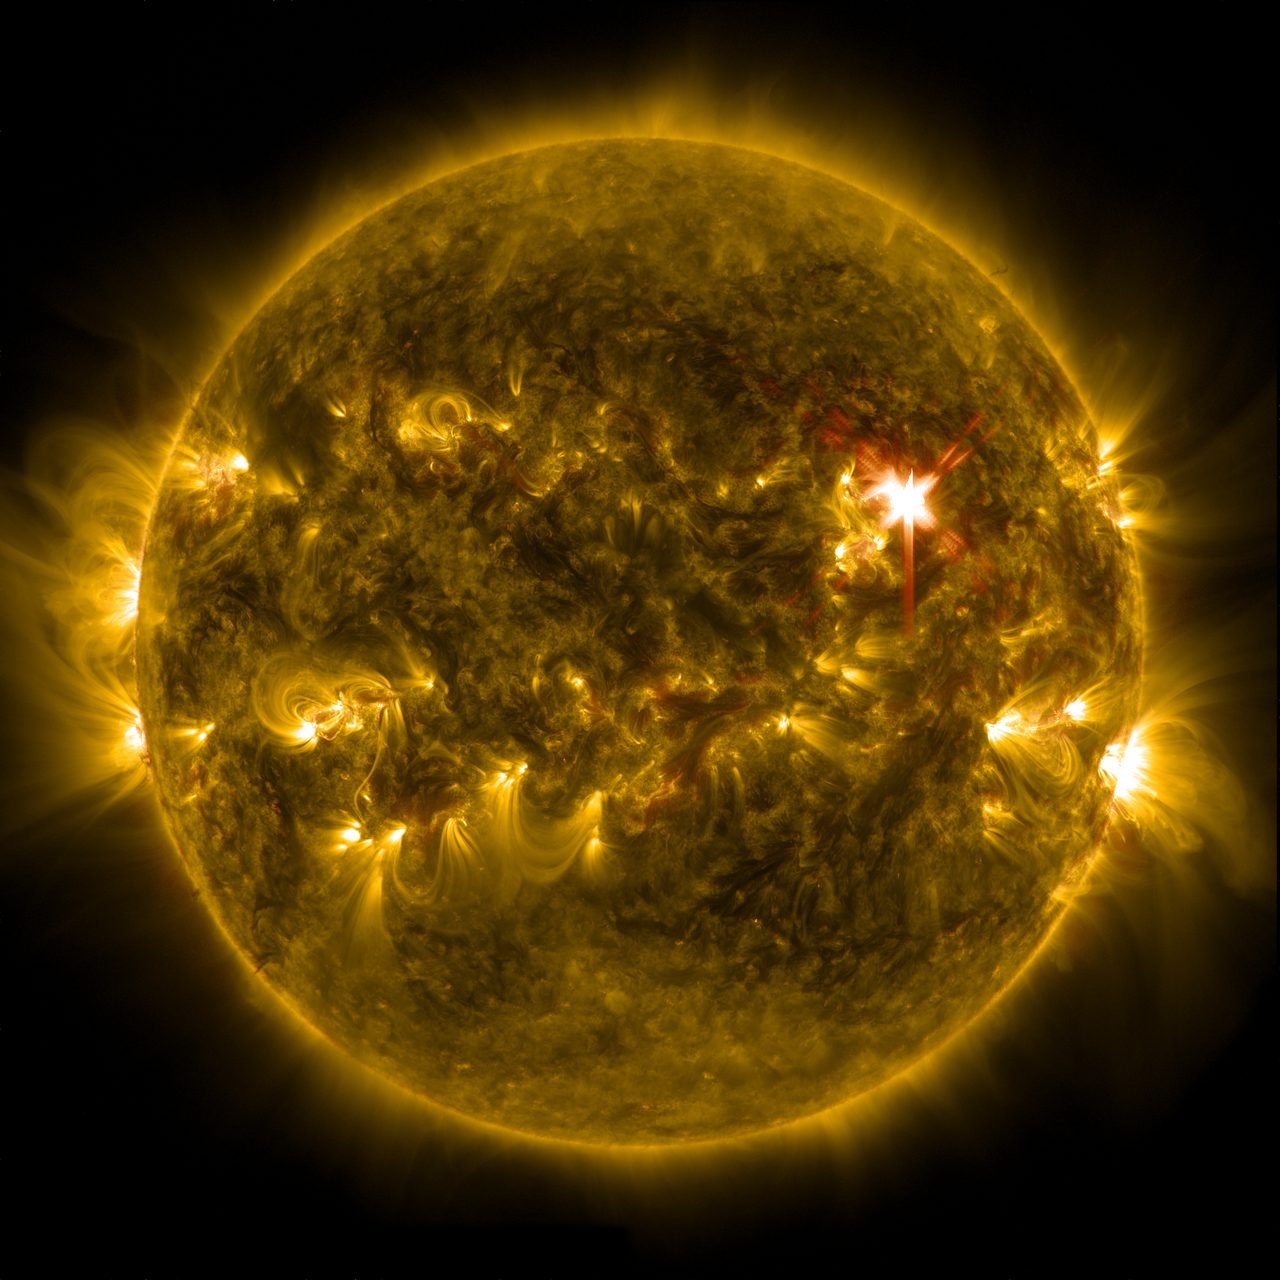
The event opens with an observation, and it is the first of its kind anyone ever made. On September 1, 1859, the British astronomer Richard C. Carrington and, independently, Richard Hodgson observed a white-light solar flare, an eruption of extraordinary brightness from a large sunspot group. It was the first documented observation of a solar flare in history.
Then a gap, and the length of the gap is itself evidence. The flare was followed approximately 17.6 hours later by the onset of a severe geomagnetic storm. A transit time that short implies a coronal mass ejection moving at roughly 2,500 kilometers per second, which is extremely fast. Typical CME transit times run 2 to 4 days.
What arrived is the largest storm on the instrumental record. The Carrington Event of September 1 to 2, 1859 was the most intense geomagnetic storm in recorded history, caused by a coronal mass ejection from the Sun striking Earth's magnetosphere.
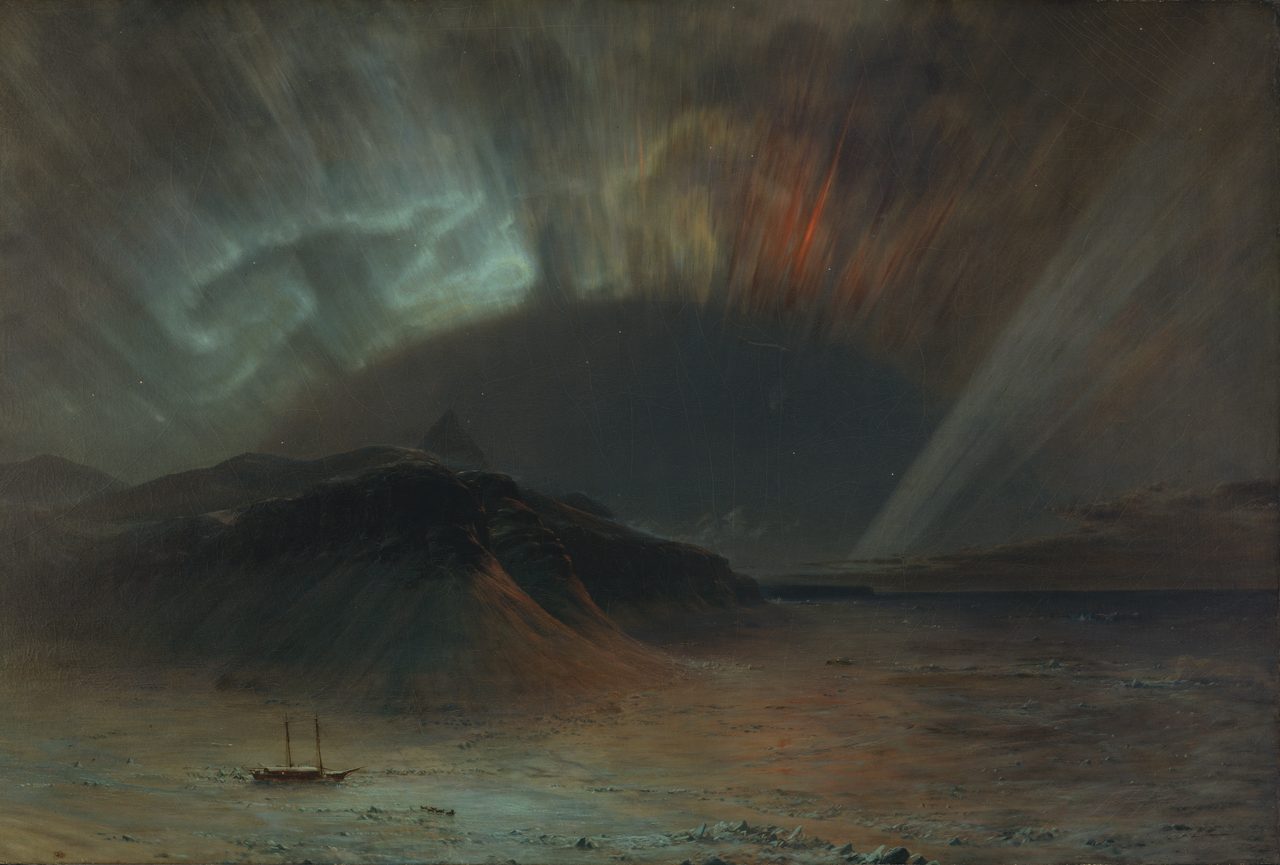
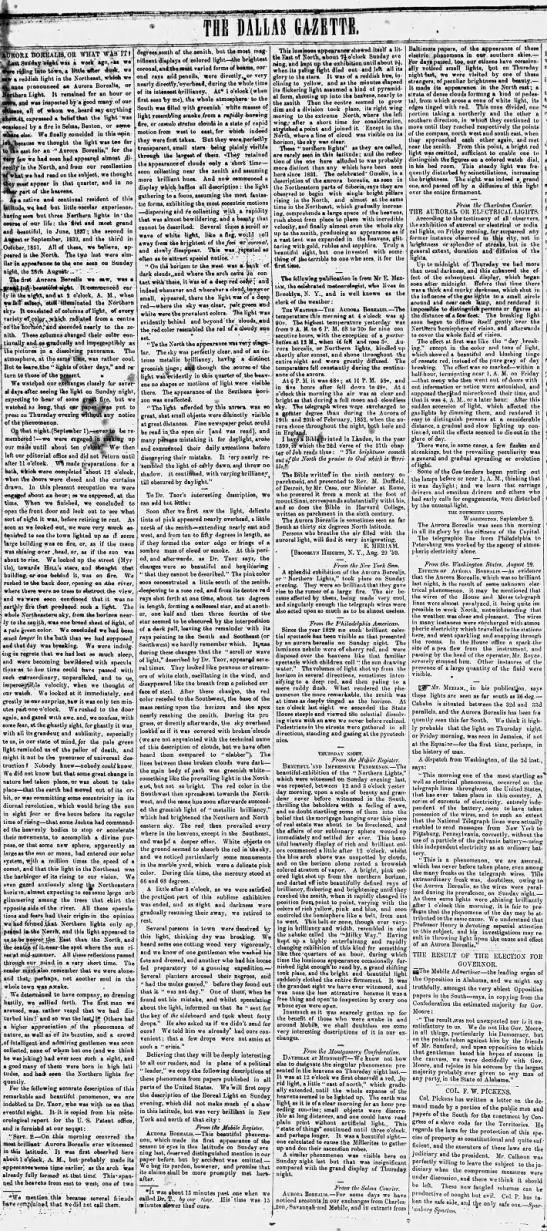
The aurora went far outside its usual band. Displays were reported down to a latitude of about 23 degrees, over the Caribbean, Mexico, Colombia and India, and to about 40 degrees south over southern Chile and New Zealand, and multiple contemporary accounts describe them as bright enough to read by. One caution on that 23 degree figure, because it is exactly the kind of detail that hardens on repetition. Our own file gives it as magnetic latitude in one place and as plain geographic latitude in another, and changes the list of places along with it, naming Sub-Saharan Africa in one and India in the other. Magnetic and geographic latitude are different coordinate systems and they do not agree with each other. The statement this article will stand behind is the one both versions support: the aurora reached the tropics.
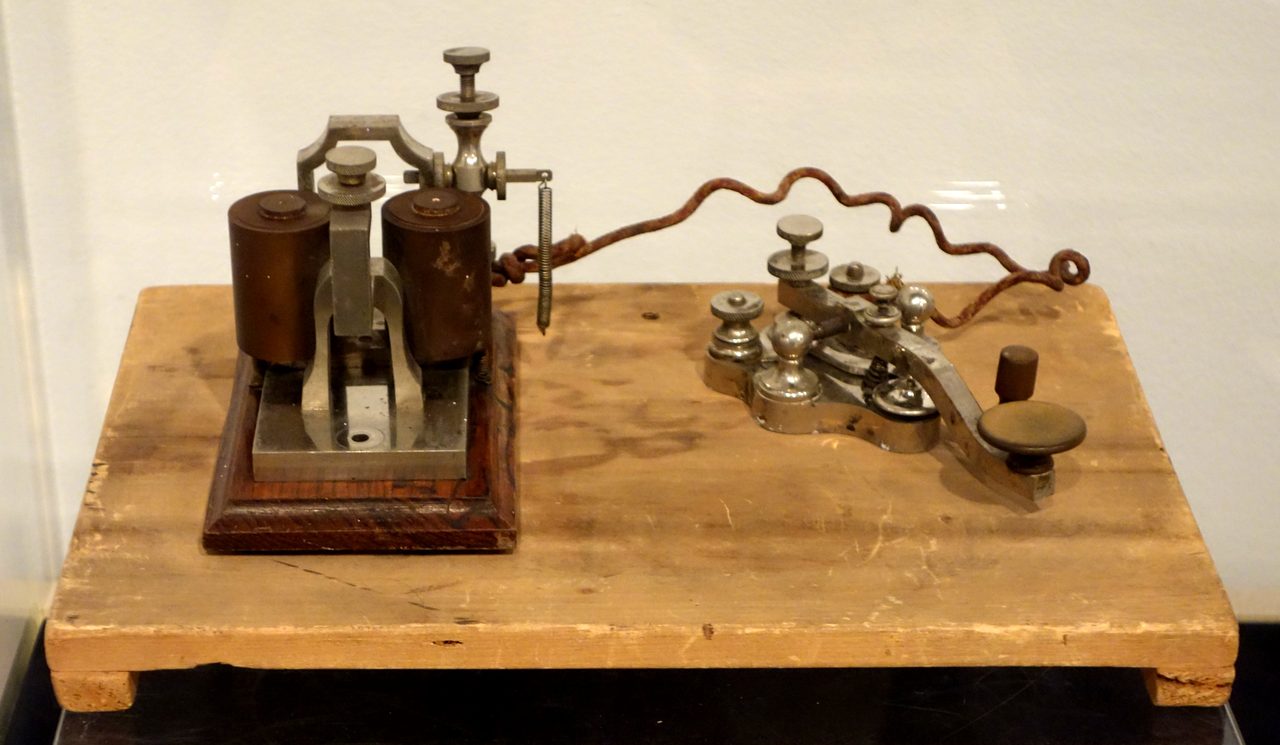
And the telegraph is the reason this storm has a name outside geophysics. Disruptions were widely documented across North America, Europe and Australia. Operators received electric shocks. Telegraph paper caught fire. Some lines went on operating for minutes to hours with their batteries disconnected, running on the currents the storm was inducing in the wires themselves. That last detail is the one worth sitting with: the network was not merely knocked over, it was briefly powered by the sky. Loomis published the auroral record in 1860 and Boteler reassessed the telegraph effects in 2006, and both are cited in our own file.
02How Strong Was It, Actually
Now the first of three disputes, and it is the one a reader is least likely to expect, because it is about the headline number itself. Ask how strong the 1859 storm was and you will be handed a single figure. There are three, they are not close together, and the distance between them decides whether 1859 stands alone or merely stands first.
One instrument is doing most of the work. The Colaba magnetometer at Mumbai recorded a horizontal magnetic field depression of approximately -1,600 nT. That is a measured local deflection at one observatory. Hold on to that phrasing, because every argument below turns on it.
The famous number is not that measurement. It is a derivation from it. Tsurutani, Gonzalez, Lakhina and Alex (2003) derived a Dst of about -1,760 nT for the 1859 storm as consistent with the Colaba local-noon horizontal-field response of dH = 1,600 plus or minus 10 nT. Dst is a global index; it measures the intensity of the ring current around the whole planet. The Colaba trace is one station's record of what happened above one place. Our own file prints -1,760 nT in its summary and -1,600 nT in its body as though one measurement were being quoted twice at different precisions. They are two different quantities, and the step between them is the entire dispute. Our file also names no source for the -1,760 figure anywhere in its thirteen-entry bibliography.
That step was challenged in print almost at once. Akasofu and Kamide published a Comment on the Tsurutani paper in the Journal of Geophysical Research in 2005, disputing the move from a single observatory's horizontal-field record to a global Dst value. That exchange is the origin of the whole three-way disagreement that follows.
Siscoe, Crooker and Clauer (2006) argued that the Colaba instrument may have been affected by local anomalies, and that the true global Dst was likely -850 to -900 nT. Notice what that concedes and what it does not. It roughly halves the headline figure while leaving 1859 the strongest recorded geomagnetic storm by a significant margin.
One strand of the literature goes considerably further, and it deserves to be put at full strength rather than mentioned in passing. Cid, Palacios, Saiz, Guerrero and Cerrato (2014) argue that the Dst given in the literature for the Carrington storm was obtained from the magnetic record of just one observatory, and question whether a local magnetic disturbance recovers on the same hyperbolic law that a global ring-current signature does. Building on their own 2013 work, they put the storm's minimum Dst at -685 nT, which they describe as comparable to the 1989 Quebec storm. If Cid and colleagues are right, the defining event of this whole subject was not in a class of its own. It was a bad storm of a kind the modern grid has already survived once.
For scale: the strongest storm of the modern era, March 1989, reached a Dst of -589 nT. Set that beside the three estimates above and the shape of the disagreement is plain. Against -1,760 nT, 1859 is a different animal entirely. Against -685 nT, it is the same animal, slightly larger.
There is a definitional trap here, and our own file walks straight into it. In the risk literature, Carrington-class is an operational threshold rather than a description of 1859, and Riley (2012) sets it at a storm with Dst below -850 nT. But -850 nT is also one of the three candidate values for the 1859 storm itself, and it is the low one. So the same number is being made to serve as both the boundary of the class and as an estimate of the event the class is named after. Whether 1859 was twice the threshold or barely reached it is precisely what is unresolved, and any sentence that treats Carrington-class and the Carrington Event as interchangeable has quietly assumed an answer.
| The Estimate | Who Derived It, And From What | What It Would Mean |
|---|---|---|
| Dst about -1,760 nT (Tier 1) | Tsurutani, Gonzalez, Lakhina and Alex (2003), derived as consistent with the Colaba local-noon horizontal-field response of dH = 1,600 plus or minus 10 nT | 1859 stands alone, roughly three times the strongest modern storm |
| Dst about -850 to -900 nT (Tier 1) | Siscoe, Crooker and Clauer (2006), arguing the Colaba instrument may have been affected by local anomalies | 1859 is still the strongest recorded geomagnetic storm by a significant margin |
| Dst about -685 nT (Tier 2) | Cid, Palacios, Saiz, Guerrero and Cerrato (2014), questioning whether a one-station local disturbance recovers on the same law a global ring-current signature does | 1859 is comparable to the 1989 Quebec storm rather than in a class of its own |
| The measurement all three rest on: about -1,600 nT (Tier 1) | The Colaba magnetometer at Mumbai, a horizontal magnetic field depression measured at one observatory | This is a local deflection, not a global index value. Every figure above is a derivation from it |
| Dst -589 nT, March 1989 (Tier 1) | The strongest storm of the modern era, recorded by the modern observatory network | The benchmark the three estimates above are all being compared against |
03From The Sun To The Wires
How a disturbance in the solar corona ends up in a transformer winding is well understood, and this section is the least contested material in the file. It is also the part that makes everything after it legible.
Coronal mass ejections are large-scale eruptions of magnetized plasma from the solar corona, carrying roughly 10^12 to 10^13 kg of material at speeds of 300 to over 3,000 km/s. Orientation decides whether one matters to us. When a CME's magnetic field points southward, anti-parallel to Earth's dayside magnetopause field, it enables efficient energy transfer into the magnetosphere through magnetic reconnection, and that is what drives a geomagnetic storm.
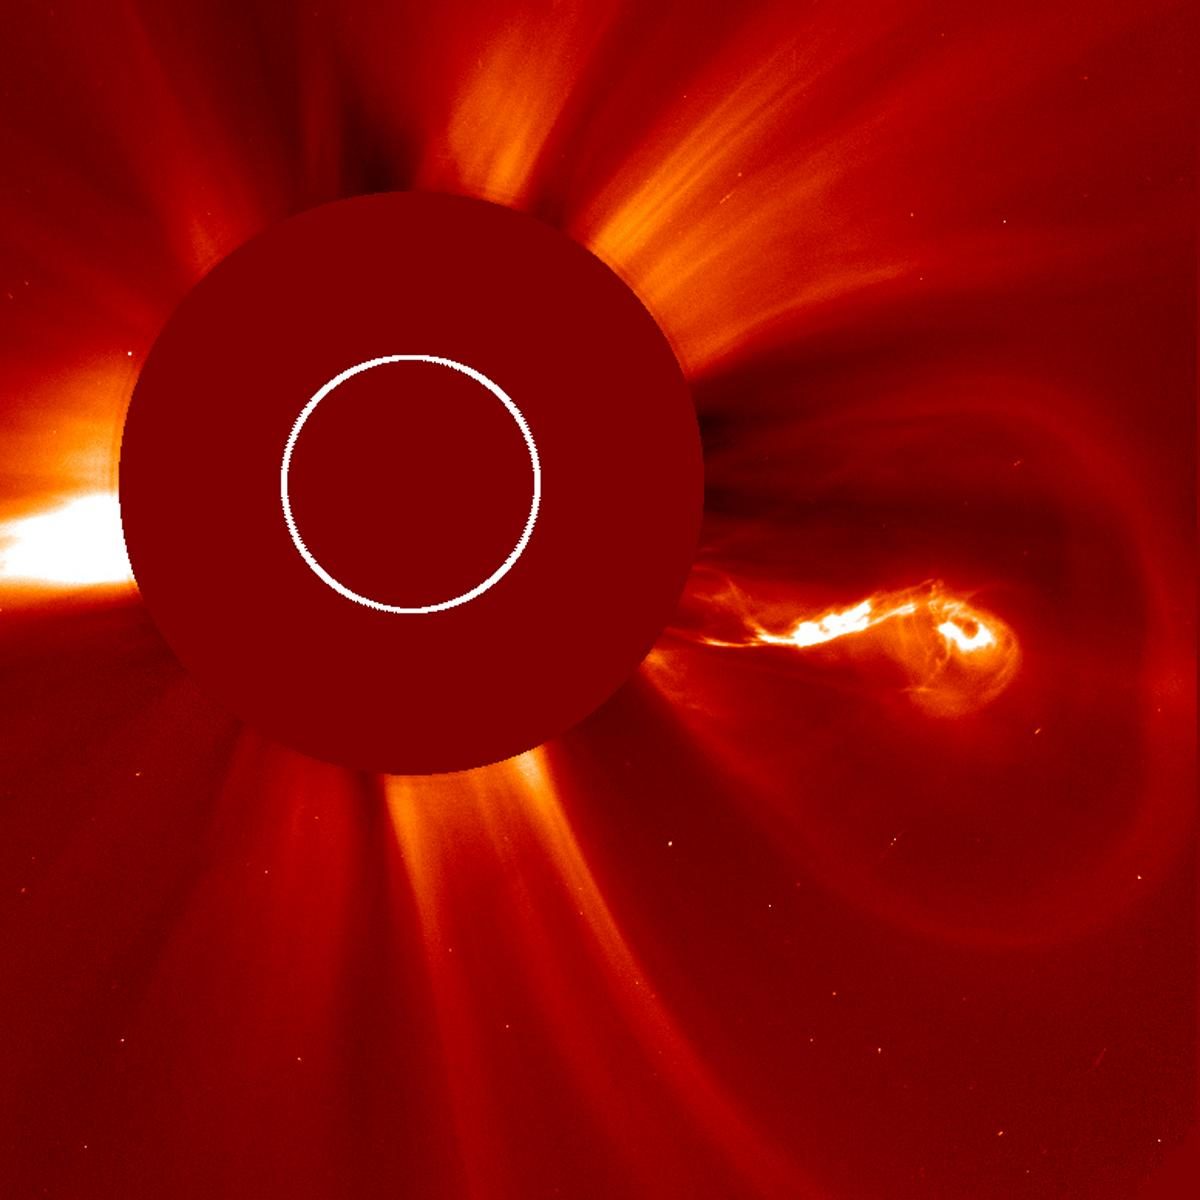
The coupling to the ground is straightforward physics. Geomagnetically induced currents arise when rapid changes in Earth's magnetic field during a storm induce electric fields in the Earth's surface, which then drive quasi-DC currents through any grounded conducting network: power grids, pipelines, undersea cables. The storm does not need to touch the hardware. It only needs the hardware to be long, conductive and earthed at both ends.
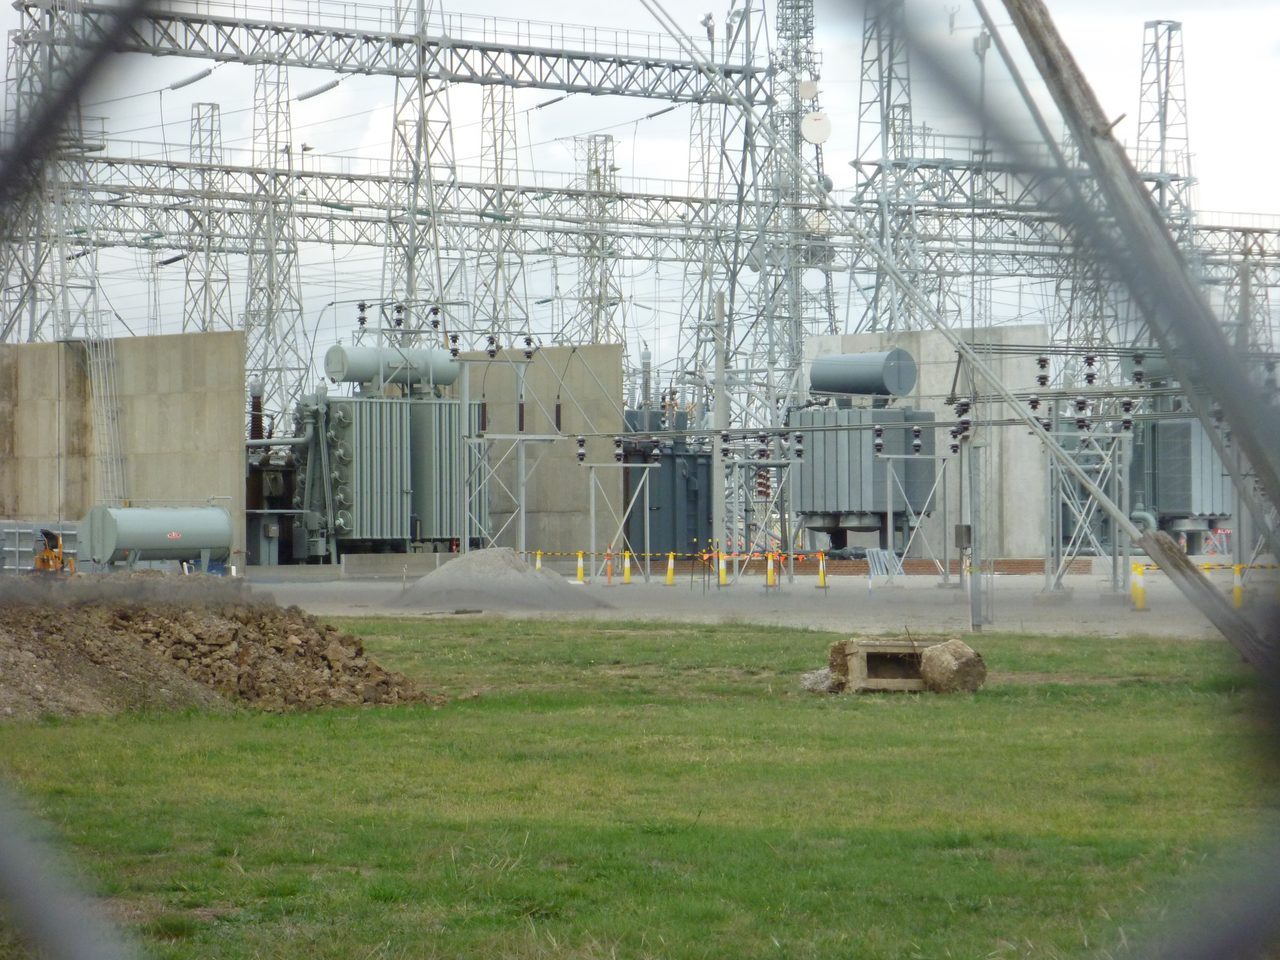
And that is where a transformer is vulnerable. In transformers, geomagnetically induced currents cause half-cycle saturation, leading to harmonic distortion, overheating, and potentially irreversible damage to high-voltage transformer windings. Irreversible is the operative word. A saturated transformer is not a device that trips and resets.
04Quebec, 1989: The Demonstration
The modern grid has already been tested once, at well under the intensity anyone worries about.
The March 1989 geomagnetic storm, at Dst -589 nT and triggered by a CME, caused the collapse of Hydro-Quebec's power grid in 92 seconds, leaving 6 million people without electricity for up to 9 hours. That is the whole demonstration: a modern power system taken down faster than a reader can finish this paragraph, by a storm nobody would call historic. Our file describes this as happening at about one third the intensity of the Carrington Event, and that ratio needs the caveat from section 02 attached to it. It holds against the -1,760 nT estimate. Against Cid's -685 nT it does not hold at all, and the 1989 storm becomes something close to a like-for-like preview.
05July 2012: The One That Missed
The strongest argument that this is a live hazard rather than a historical curiosity is not from 1859. It is from a July morning in 2012, and the only reason it is not a disaster story is orbital timing.
On July 23, 2012 the STEREO-A spacecraft, orbiting the Sun ahead of Earth, detected a CME that passed through Earth's orbital position. Analysis by Baker and colleagues, published in Space Weather in 2013, concluded that the CME's speed of about 2,500 km/s, its magnetic field strength and its duration were all comparable to the 1859 Carrington Event.
Earth had passed through that same orbital position approximately one week earlier. Had the eruption occurred 7 to 9 days sooner, Earth would have been directly in the CME's path.
Two figures from that work are worth carrying with their status marked. Baker's own summary of the event, as reported by NASA, is that in his view the July 2012 storm was in all respects at least as strong as the 1859 Carrington event. NASA's account of the same work gives a Dst for the July 2012 storm of about -1,200 nT had it struck Earth, describing that as comparable to the Carrington Event and twice as severe as the March 1989 Quebec storm. That -1,200 nT is a modelled counterfactual for a storm that did not hit us, not a measurement of one that did, and it reaches this article through a NASA popular-science feature rather than through the peer-reviewed paper. It belongs in the article, labelled, and not in a headline.
The near-miss underscored that Carrington-class events are not merely historical curiosities but occurring solar phenomena, and that one could strike Earth with essentially no warning beyond the roughly 15 to 60 minute transit time from the L1 monitoring point to Earth. Section 09 takes that last clause apart, because it is the single most misquoted sentence in this subject.
06The Trillion Dollar Figure, And Where It Comes From
Here is the number everybody has heard, and here is what it actually is. This is the part of the file where our own document is least reliable, so the corrections are stated in the open rather than smoothed over.
Our file leads with $1 to $2 trillion in first-year economic damages from a Carrington-class event, with recovery taking 4 to 10 years, attributed to the National Academy of Sciences in 2008. Three things about that attribution are wrong, and they compound. It is not a National Academy finding: it is a scenario analysis by John Kappenman of Metatech Corporation, reproduced inside a National Research Council workshop report, a format that records what participants presented rather than endorsing it. The modelled storm is not Carrington-class: it is a repeat of the May 1921 geomagnetic storm, which is smaller than 1859. And the figure is United States only, not global. Every popular retelling that says a Carrington event would cost the world one to two trillion dollars has inherited all three errors at once.
Stated properly, the scenario is this. Kappenman and Metatech modelling of a repeat of the May 1921 storm predicts permanent damage to roughly 350 extra-high-voltage transformers in the United States, up to about 130 million people without power, a first-year United States economic impact of $1 to $2 trillion, and full recovery in 4 to 10 years depending on the extent of the damage. That is a real, specific, published scenario by a named modeller, and it is worth taking seriously on those terms. What it is not is a consensus estimate, a measurement, or a finding of the National Academies.
It also did not go unexamined. The 2011 JASON review, commissioned by the Department of Homeland Security to assess exactly this worst-case grid scenario, declined to endorse it. Its stated conclusion, as reported by the Federation of American Scientists, was that the reviewers were not convinced the worst case scenario is plausible, nor that the analysis behind it, built on proprietary algorithms, is suitable for deciding national policy. JASON recommended instead that a rigorous and fully transparent risk analysis of the United States grid be carried out. That review appears nowhere in our own research file, which is the single largest gap in it: the document presents a contested scenario as settled by leaving out the body that contested it.
One detail inside that scenario has been mangled in transmission, and our own file mangles it. The file states that the United States alone has approximately 350 high-voltage transformers of the type most vulnerable to damage. That is a misreading of the scenario's own output. The 350 figure is the number of extra-high-voltage transformers the model predicts would be permanently damaged, not a count of how many exist. The real United States fleet is far larger. The JASON review describes the same scenario as predicting catastrophic damage to more than 300 extra high voltage transformers, which is the same quantity said correctly. Read as a census, the sentence tells a reader that the American grid rests on 350 machines. It does not, and the difference matters in both directions: the loss is smaller than the sentence implies as a share of the fleet, and the sentence is worthless as a description of the fleet.
The reason any of this takes years rather than weeks is manufacturing, not repair. Our file gives high-voltage transformers of this type typical replacement lead times of 12 to 24 months, and notes that most are custom-manufactured overseas. That figure is now out of date, and the update runs against our file rather than for it. Large power transformers are custom-designed and historically carried procurement lead times of one year or longer, stretching beyond 20 months when key parts or materials were hard to obtain; as of the 2024 Department of Energy Large Power Transformer Resilience Report to Congress, 36-month lead times are commonly quoted and maximum lead times reach as much as 60 months. If the recovery argument depends on the replacement bottleneck, and it does, the honest current number makes the point more forcefully than the one our file carries.
There is a second major estimate, from the insurance side, and it must not be blended with the first. Lloyd's of London, in a 2013 report produced with Atmospheric and Environmental Research, estimated that 20 to 40 million Americans could lose power from a Carrington-level storm, with cascading impacts on water supply, food distribution, medical systems, financial systems and communications. Our file gives the outage as weeks to months; the report's own range is wider and franker, 16 days to one or two years depending on replacement transformer availability. It put total economic losses at up to about $2.6 trillion and placed the greatest risk along the Atlantic corridor between New York and Washington DC, with elevated risk in parts of the Midwest and along the Gulf Coast. That $2.6 trillion is a different and larger figure from the $1 to $2 trillion above, produced by different people modelling a different thing. The two are not a range and should never be quoted as one.
On the defensive side the picture is real but modest. Mitigation measures including GIC blocking devices, transformer monitoring, strategic spare transformer stockpiles and improved space weather forecasting have been partially implemented since the 2008 report, but progress is incremental and most national grids remain significantly vulnerable.
| The Source | What It Actually Models | The Figure It Gives |
|---|---|---|
| Kappenman and Metatech, reproduced inside the 2008 National Research Council workshop report | A repeat of the May 1921 geomagnetic storm, which is smaller than 1859. United States only | Roughly 350 extra-high-voltage transformers permanently damaged, up to about 130 million people without power, $1 to $2 trillion first-year United States economic impact, 4 to 10 years to full recovery (Tier 2) |
| The 2011 JASON review, commissioned by the Department of Homeland Security | A formal assessment of that same worst-case scenario | Declined to endorse it, and recommended a rigorous and fully transparent risk analysis of the United States grid instead (Tier 2) |
| Lloyd's of London with Atmospheric and Environmental Research, 2013 | A Carrington-level storm over the North American electric grid | 20 to 40 million Americans losing power, outages of 16 days to one or two years depending on replacement transformer availability, total economic losses up to about $2.6 trillion (Tier 2) |
| Our own research file | Reports the first row as a National Academy of Sciences estimate for a Carrington-class event | $1 to $2 trillion, 4 to 10 years, the 350 transformers restated as a fleet census, and no mention of JASON anywhere |
07How Often: Four Papers, Four Answers
The third contested number is the recurrence rate, and it is contested in a specific and instructive way. Every estimate below is built from the same historical storm record. They differ by more than a factor of ten anyway, because they differ about how a statistician should treat the tail of a distribution. Each one is given here with its author and with what that author actually counted.
Riley, in Space Weather in 2012, estimated the probability of a Carrington-class event, defined as Dst below -850 nT, within a decade at approximately 12 percent, derived from extreme-value statistics applied to the historical record of geomagnetic storm intensities. This is a genuine published estimate, correctly cited in our file, and it is also the highest figure in the literature and the one popular writing reaches for. It should never appear on its own.
Kataoka, in Space Weather in 2013, estimates the probability of another Carrington-type storm over the next decade at 0.04 to 0.06, that is 4 to 6 percent, using cumulative distribution functions built from an 89-year list of magnetic storms recorded at Kakioka. Our own file cites this paper for a figure of roughly 1 to 4 percent per decade. That is not its result.
Chapman, Horne and Watkins, in Geophysical Research Letters in 2020, are not measuring the same thing at all. Using the aa index across the last 14 solar cycles, they report a 14-cycle average of roughly 4 percent chance per year of at least one great storm, meaning Dst below -500 nT, and roughly 28 percent per year of at least one severe storm below -250 nT, and they frame a Dst of about -809 nT as roughly a 1-in-151-year event. They note that the Carrington event's estimated amplitude sits within the same distribution as other extreme activity seen in the aa index since 1868. Co-author Richard Horne's own summary of the result is that a super-storm can happen more often than we thought. Our file cites this paper as producing a lower estimate. It is per year rather than per decade, and its own conclusion points in the opposite direction.
The real floor of the published range belongs to a paper our file never cites. Morina, Serra, Puig and Corral, in Scientific Reports in 2019, estimate the probability of a Carrington-like event with Dst below -850 nT in the next decade at 0.92 percent, with a 95 percent confidence interval of 0.46 to 1.87 percent, using a counting process with Weibull inter-occurrence times. The authors state explicitly that this is substantially lower than the roughly 12 percent previously reported, and they attribute the difference to exponential rather than power-law behaviour in the tail of the Dst distribution. That is the actual disagreement, stated by the people having it: not about the Sun, but about the shape of a tail.
Our own file closes its probability section by calling one to twelve percent per decade the consensus range. No paper says that. The envelope happens to bracket the four estimates above, but no source states it as a consensus and our file names none, so this article carries the four estimates separately and carries no consensus figure at all. The second half of that sentence, that this is a low-probability and extremely-high-consequence risk, is an editorial characterisation rather than a finding, and as a characterisation it is fair.
| Who Said It | What They Actually Measured | The Figure They Give |
|---|---|---|
| Riley (2012), Space Weather | Extreme-value statistics applied to the historical record of geomagnetic storm intensities, for a storm with Dst below -850 nT | Approximately 12 percent within a decade. The highest published estimate and the most quoted (Tier 2) |
| Kataoka (2013), Space Weather | Cumulative distribution functions built from an 89-year list of magnetic storms recorded at Kakioka | 4 to 6 percent over the next decade (Tier 2) |
| Morina, Serra, Puig and Corral (2019), Scientific Reports | A counting process with Weibull inter-occurrence times, for Dst below -850 nT | 0.92 percent in the next decade, 95 percent confidence interval 0.46 to 1.87 percent (Tier 2) |
| Chapman, Horne and Watkins (2020), Geophysical Research Letters | The aa index across the last 14 solar cycles, counting storms per year rather than per decade | Roughly 4 percent per year for a great storm below -500 nT, roughly 28 percent per year for a severe storm below -250 nT, and a Dst of about -809 nT framed as a 1-in-151-year event (Tier 2) |
| Our own research file | Attributes a roughly 1 to 4 percent per decade figure to Kataoka and to Chapman and colleagues, then calls one to twelve percent per decade the consensus | Neither paper gives that figure, Morina is not cited at all, and no source is named for the consensus range |
One line from further back, and only one, because that record has its own file in this wing. Geological proxies, beryllium-10 and carbon-14 spikes in ice cores and tree rings, record several solar particle events over the past 10,000 years that may have exceeded the Carrington Event, of which the Miyake events of 774 CE and 993 CE are the strongest identified. The caution attached is important: those were extreme solar energetic particle events rather than necessarily extreme CME-driven geomagnetic storms, so they are evidence that the Sun can do more than 1859, not evidence about how often it does 1859.
08The Scenarios Nobody Can Price
Below the cost models sits a layer of scenario writing that is genuinely speculative, and this is where popular treatments of this subject do most of their damage. It is carried here at the tier our own file assigns it, and not a step higher.
Some risk analysts have suggested that a Carrington-class event, combined with modern society's near-total dependence on electricity and digital systems, could trigger cascading infrastructure collapse potentially resulting in large-scale fatalities, from loss of water treatment, medical care and food distribution. Our file states that these catastrophic scenarios are plausible but depend heavily on the duration of the outage, its geographic extent, government response and pre-positioned mitigation. It names no analyst and no study for any of it, which is why this sits where it sits. The dependencies are the honest part of the claim: every one of them is a variable nobody has measured, because the event has not happened to a wired civilization.
09Would It Arrive Without Warning?
And here the file gets to say no to something, which is the most useful thing it does.
Claims that a solar superstorm could strike without warning are partially misleading. Solar flares travel at light speed, giving roughly an 8-minute warning of the flare itself, while CMEs take 15 to 96 or more hours to reach Earth. The DSCOVR satellite at L1 provides approximately 15 to 60 minutes of advance warning once the CME passes L1, and ACE and DSCOVR data enable real-time forecasting that did not exist in 1859. The truthful version of the sentence is much less dramatic and much more useful: the warning is short, it is not zero, and what it is short for is protective action on a grid, not evacuation.
That window is confirmed by the agency operating the satellite. NOAA's Space Weather Prediction Center states that from its position at Lagrange point 1, about one million miles from Earth, DSCOVR can typically provide 15 to 60 minutes of warning before a CME's particles and magnetic field reach Earth, by observing sudden increases in density, total interplanetary magnetic field strength and solar wind speed.
Fast Facts
- The Event
- The Carrington Event, the most intense geomagnetic storm in recorded history, September 1 to 2, 1859
- The Flare
- Observed on September 1, 1859 by Richard C. Carrington and independently by Richard Hodgson: the first documented solar flare
- Transit Time
- Approximately 17.6 hours from flare to storm onset, implying a CME at roughly 2,500 km/s against a typical 2 to 4 days
- How Strong
- Disputed. About -1,760 nT (Tsurutani 2003), -850 to -900 nT (Siscoe 2006) or -685 nT (Cid 2014), all derived from one Colaba trace of about -1,600 nT
- The Aurora
- To the tropics, and to about 40 degrees south, bright enough to read by. The often quoted 23 degree figure is given as magnetic latitude in one place in our file and as geographic in another, so the body carries the claim both versions support
- The Telegraph
- Shocks to operators, paper on fire, and some lines running for minutes to hours with their batteries disconnected
- Modern Benchmark
- March 1989, Dst -589 nT: the Hydro-Quebec grid collapsed in 92 seconds and 6 million people lost power for up to 9 hours
- The Near Miss
- July 23, 2012: a CME comparable to 1859 crossed Earth's orbital position about a week after Earth had left it
- The Cost Figure
- $1 to $2 trillion first-year United States impact, from a Kappenman and Metatech scenario for a repeat of the smaller 1921 storm, reproduced in a 2008 NRC workshop report and not endorsed by the 2011 JASON review (Tier 2)
- The Transformer Number
- Roughly 350 extra-high-voltage transformers is a predicted damage count, not a census of the United States fleet (Tier 2)
- Replacement Lead Time
- 12 to 24 months in our own file; 36 months commonly quoted and up to 60 months at maximum in the 2024 DOE report (Tier 2)
- Odds Of A Repeat
- No consensus figure exists. Published per-decade estimates run from 0.92 percent (Morina 2019) to about 12 percent (Riley 2012), with 4 to 6 percent from Kataoka (2013) (Tier 2)
- Warning Time
- Roughly 8 minutes for the flare, 15 to 96 or more hours of CME travel, and approximately 15 to 60 minutes of hard warning once the CME passes L1
What We Can Actually Stand Behind
The 1859 event happened and its effects are documented. Carrington and Hodgson observed the white-light flare on September 1, 1859, the first ever documented; a severe geomagnetic storm began approximately 17.6 hours later, implying a CME at roughly 2,500 km/s; the aurora reached the tropics and was bright enough to read by; and telegraph disruptions were widely documented across North America, Europe and Australia, including shocks to operators, paper catching fire, and lines operating with their batteries disconnected. The mechanism is equally solid: CMEs drive storms when their field points southward, storms drive geomagnetically induced currents in grounded conductors, and those currents drive half-cycle saturation in transformers. So is the modern evidence. March 1989 collapsed the Hydro-Quebec grid in 92 seconds at Dst -589 nT, and the July 2012 CME that crossed Earth's orbital position was comparable to 1859 on the analysis of Baker and colleagues.
Three of the most quoted things about this subject are unresolved, and this article does not resolve them. How strong 1859 was is a live three-way dispute running from about -1,760 nT down to -685 nT, all derived from a single observatory's trace, and the low end would make 1859 comparable to 1989 rather than unique. The cost figure is a Kappenman and Metatech scenario for a repeat of the smaller May 1921 storm, United States only, reproduced inside an NRC workshop report and explicitly not endorsed by the 2011 JASON review, and the separate Lloyd's estimate of up to about $2.6 trillion is a different number from a different model that must not be merged with it. And the recurrence rate spans more than a factor of ten across four published papers, from 0.92 percent per decade to about 12 percent, with Chapman and colleagues measuring per year rather than per decade and concluding that super-storms are more frequent than previously thought. No source states a consensus range, so this article prints none.
The catastrophic-collapse scenarios stay at this tier deliberately. That a Carrington-class storm could cascade into large-scale fatalities through loss of water treatment, medical care and food distribution is a suggestion attributed to unnamed risk analysts in our own file, resting on no named study, and our file itself concedes that the outcome depends heavily on outage duration, geographic extent, government response and pre-positioned mitigation. Those dependencies are unmeasured because the experiment has not been run on a wired civilization. Plausible is the strongest word this material has earned.
No, it would not arrive without warning. That claim is partially misleading and it is the most repeated sentence in this subject. A flare is visible at light speed, roughly 8 minutes out. A CME takes 15 to 96 or more hours to cross to Earth, which is forecast lead time at lower confidence. And once it passes the L1 monitoring point, DSCOVR provides approximately 15 to 60 minutes of hard warning by observing the jump in density, magnetic field strength and solar wind speed, which NOAA's own Space Weather Prediction Center confirms independently of our file. None of that is much time. All of it is more than zero, and none of it existed in 1859.
So the 1859 storm is not the uncertain part. Two men watched the flare, the aurora came down into the tropics, and telegraph operators on three continents wrote down what their instruments did while the wires were live with a current nobody had put there. That record has survived a century and a half of scrutiny. What has not survived scrutiny is the tidy modern sentence built on top of it, the one that pairs a trillion dollar price tag with a single tempting probability. Both halves come from real papers. Neither says what it is quoted as saying. The cost scenario models a smaller storm, in one country, inside a workshop report, and the government review commissioned to check it would not sign it. The probability most often repeated is the highest of four published estimates that disagree by more than a factor of ten, and they disagree not about the Sun but about how to treat the tail of a distribution. Which leaves a question smaller than the headline and harder to answer than either number. We know the storm can happen, because it did. We know a grid can fall, because one did in Quebec in 1989. What nobody has yet established, in a figure anyone could defend, is how much of the second follows from the first.
Sources & further reading
Everything above is drawn from our research library on Theories of Anything, and this file needed more handling in the open than most. Six things. Our file's headline figure for the 1859 storm, a Dst of about -1,760 nT, carries no citation anywhere in it: the number is Tsurutani, Gonzalez, Lakhina and Alex (2003), linked below. Our file credits a Dst of -850 to -900 nT jointly to Siscoe and colleagues and to Cid et al. (2015); the -850 nT end is fairly Siscoe's, while Cid and colleagues actually argue for -685 nT in a 2014 paper, and the 2015 Cid paper our file names is about a storm observed in the 21st century, not a reanalysis of 1859. Both Cid papers are linked below so the difference can be checked directly. Our file presents the $1 to $2 trillion figure as a National Academy of Sciences estimate for a Carrington-class event; it is a Kappenman and Metatech scenario for a repeat of the smaller May 1921 storm, United States only, reproduced inside a National Research Council workshop report, and the 2011 JASON review commissioned to assess it declined to endorse it. Our file does not mention JASON at all. Our file also reads that scenario's prediction of roughly 350 destroyed extra-high-voltage transformers as a count of how many such transformers exist, which it is not. Our file attributes a roughly 1 to 4 percent per decade recurrence figure to Kataoka (2013) and to Chapman and colleagues (2020); neither paper gives it, and the paper that does give a figure near 1 percent, Morina and colleagues (2019), is absent from our file entirely. And our file's closing consensus range of one to twelve percent per decade has no named source, so this article does not carry it. Several sources named in the prose have no stable identifier in our file and are cited by name rather than linked: Carrington (1860) and Loomis (1860), the National Research Council's 2008 workshop report, the Lloyd's of London 2013 report produced with Atmospheric and Environmental Research, the 2024 Department of Energy Large Power Transformer Resilience Report to Congress, and NOAA Space Weather Prediction Center material on DSCOVR. All of the above is logged for a future corpus pass. Open the full file to check the sourcing and go deeper.
Image credits
- Richard Carrington's drawing of the sunspot group of September 1, 1859 Richard Christopher Carrington, via Wikimedia Commons. The background of this reproduction was digitally replaced by a Commons editor in 2025, so the plain ground behind the drawing is not original.. Public Domain Source.
- Aurora Borealis, oil on canvas, Frederic Edwin Church, 1865 Frederic Edwin Church, Smithsonian American Art Museum, gift of Eleanor Blodgett, accession 1911.4.1, via Wikimedia Commons. Public Domain Source.
- Page of an American newspaper of 1859 carrying a compilation of aurora reports Anonymous, via Wikimedia Commons. Catalogued there as The Cahaba Gazette of Cahaba, Alabama, September 9, 1859; the running head printed at the top of the sheet reads The Dallas Gazette, and the columns carry datelines of August 29 and September 2, 1859.. Public Domain Source.
- Telegraph key and sounder, Western Electric Manufacturing Company, Chicago, circa 1876 Daderot (own work, 2013), exhibit in the Wisconsin Historical Museum, Madison, via Wikimedia Commons. CC0 1.0 Source.
- Coronal mass ejection recorded by the SOHO LASCO C2 coronagraph, late February 2013 NASA Goddard Space Flight Center, SOHO LASCO C2 imagery, archive image GSFC_20171208_Archive_e001543, via Wikimedia Commons. Public Domain Source.
- Keilor Terminal Station, a transmission substation in western Melbourne, 2010 Allalone89 (own work, 2010), via Wikimedia Commons. Public Domain Source.
- X-class solar flare of March 29, 2014, Solar Dynamics Observatory NASA / Solar Dynamics Observatory, Goddard Space Flight Center, via Wikimedia Commons. Public Domain Source.
- Card crop of Coronal mass ejection recorded by the SOHO LASCO C2 coronagraph, late February 2013 NASA Goddard Space Flight Center, SOHO LASCO C2 imagery, archive image GSFC_20171208_Archive_e001543, via Wikimedia Commons. Public Domain Source.


.jpg)

